Eerst het belangrijkste
ARIMA-modellen in R

David Stoffer
Professor of Statistics at the University of Pittsburgh
Over mij

Over mij
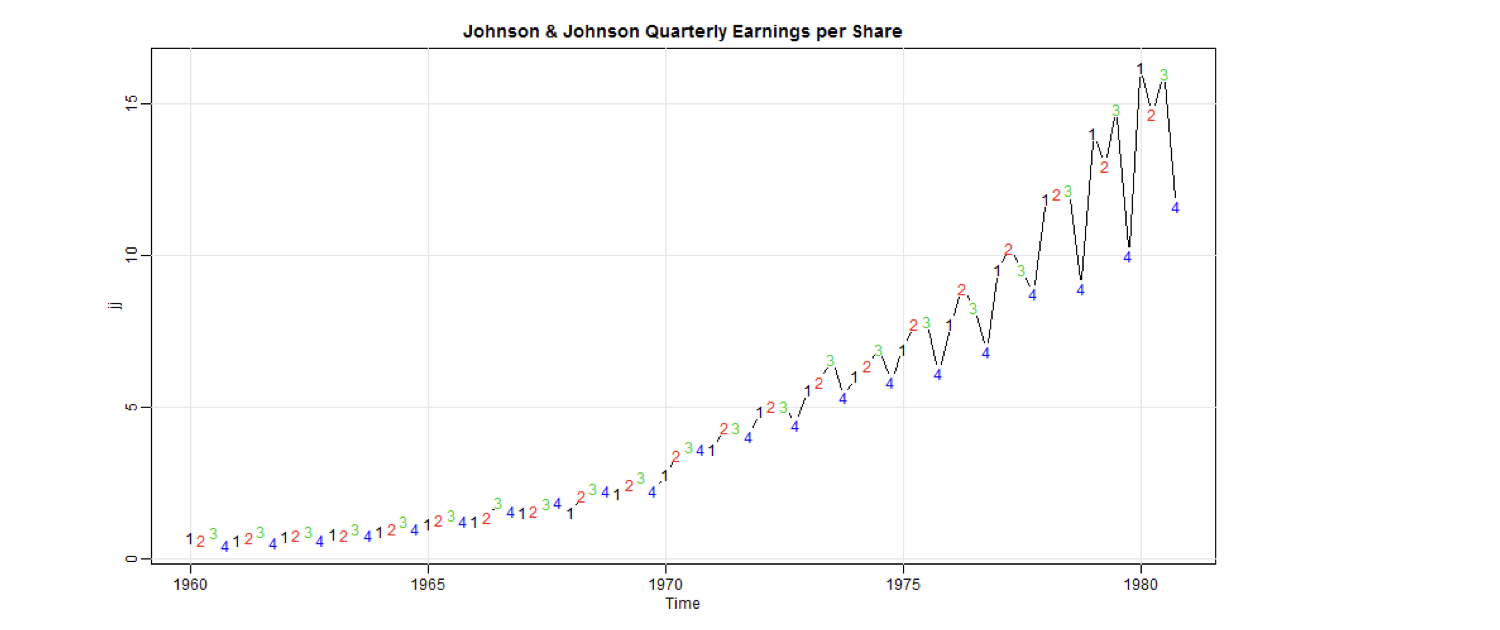
Tijdreeksdata - I
library(astsa)
plot(jj, main = "Johnson & Johnson Quarterly Earnings per Share", type = "c")
text(jj, labels = 1:4, col = 1:4)
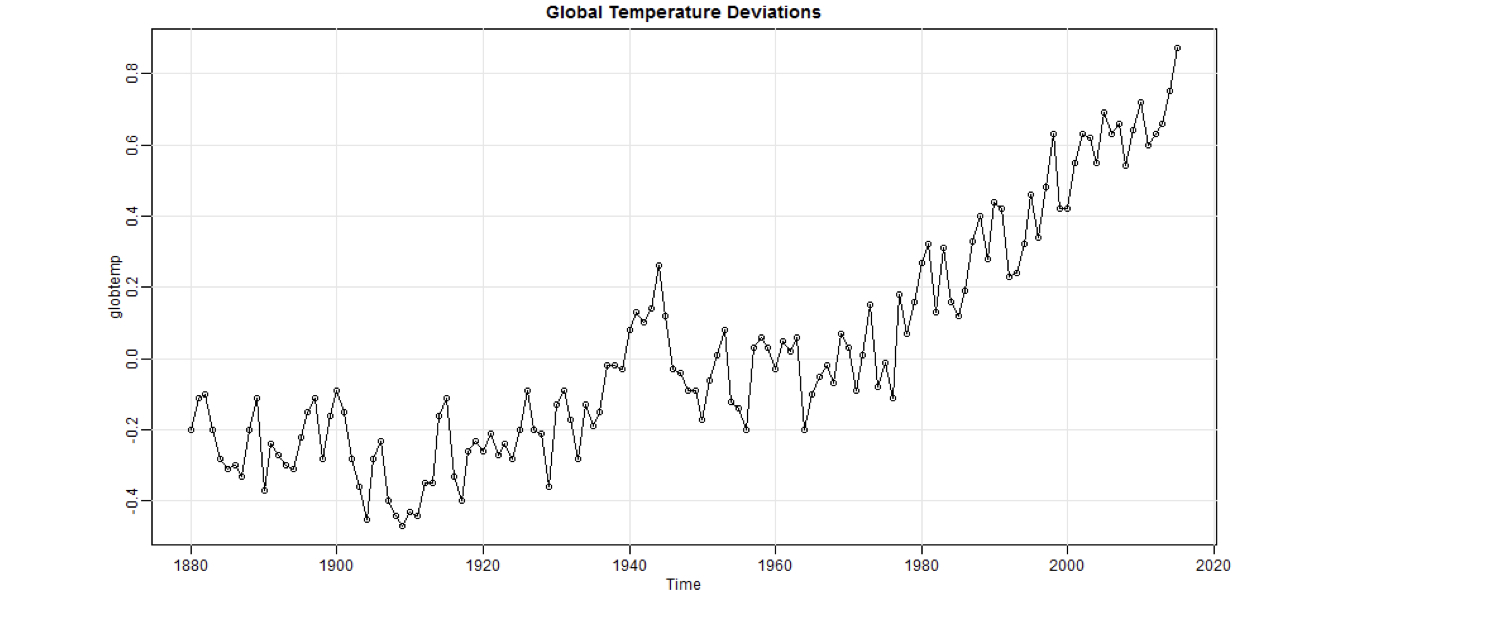
Tijdreeksdata - II
library(astsa)
plot(globtemp, main = "Global Temperature Deviations", type= "o")
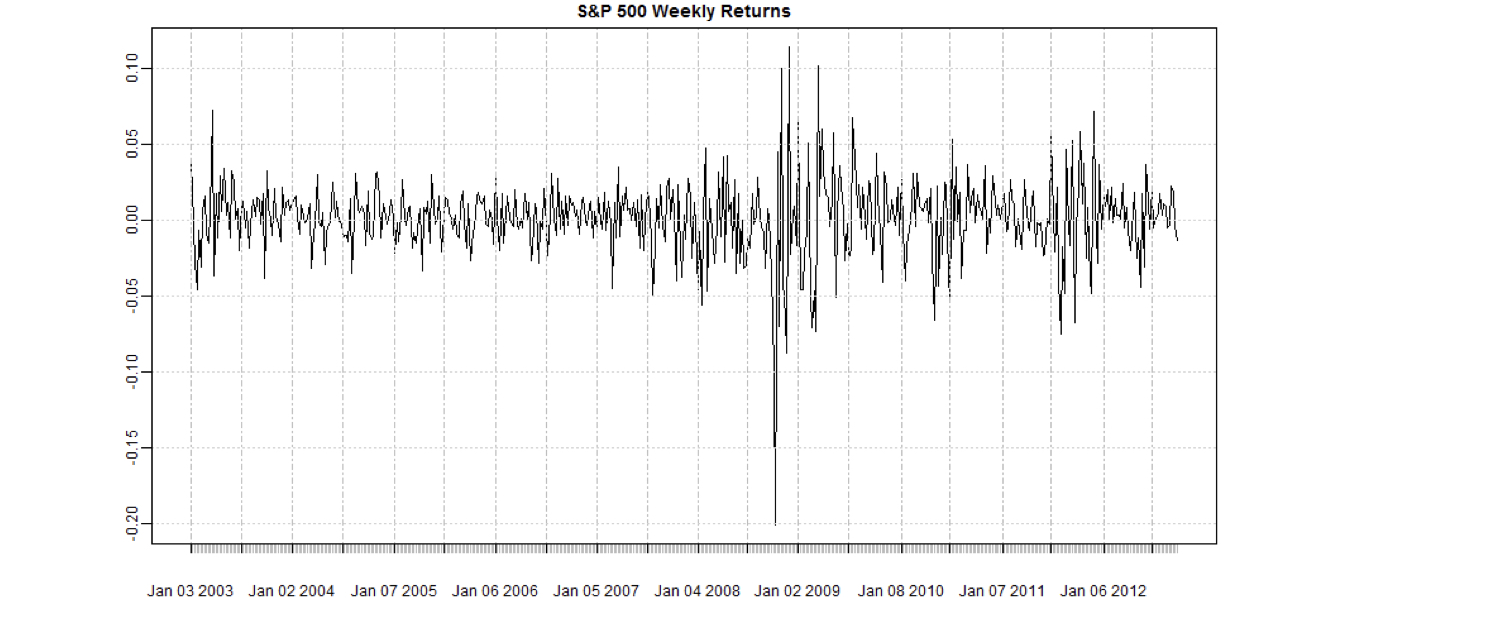
Tijdreeksdata - III
library(xts)
plot(sp500w, main = "S&P 500 Weekly Returns")