Visualisaties maken met Seaborn
Introductie tot Python in Power BI

Jacob H. Marquez
Data Scientist
Plots met het Seaborn-pakket
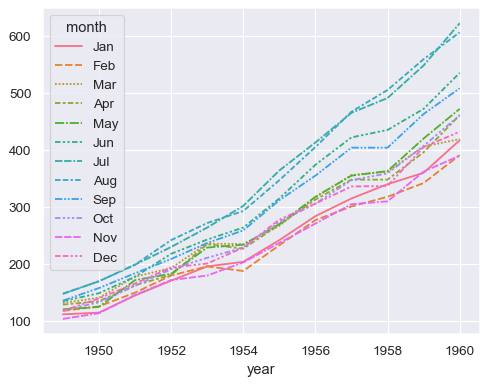
1 https://seaborn.pydata.org/generated/seaborn.lineplot.html
Plots met het Seaborn-pakket
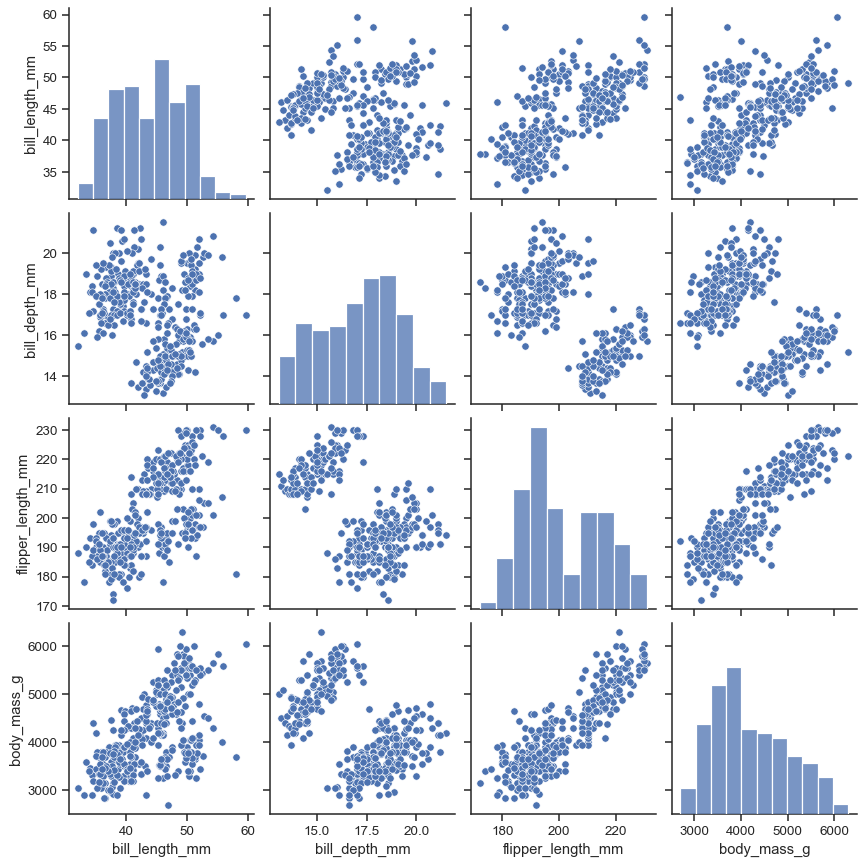
1 https://seaborn.pydata.org/generated/seaborn.pairplot.html
Plots met het Seaborn-pakket
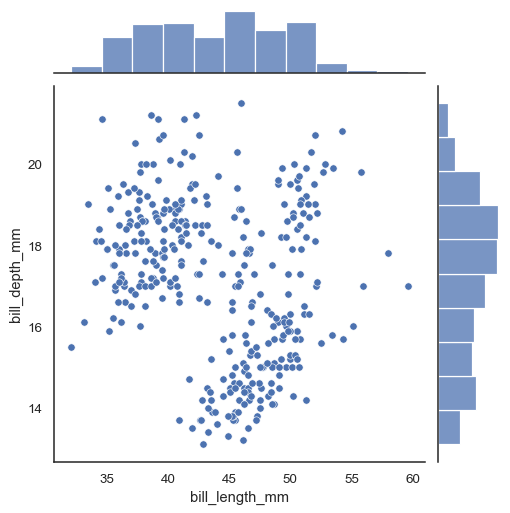
1 https://seaborn.pydata.org/generated/seaborn.jointplot.html
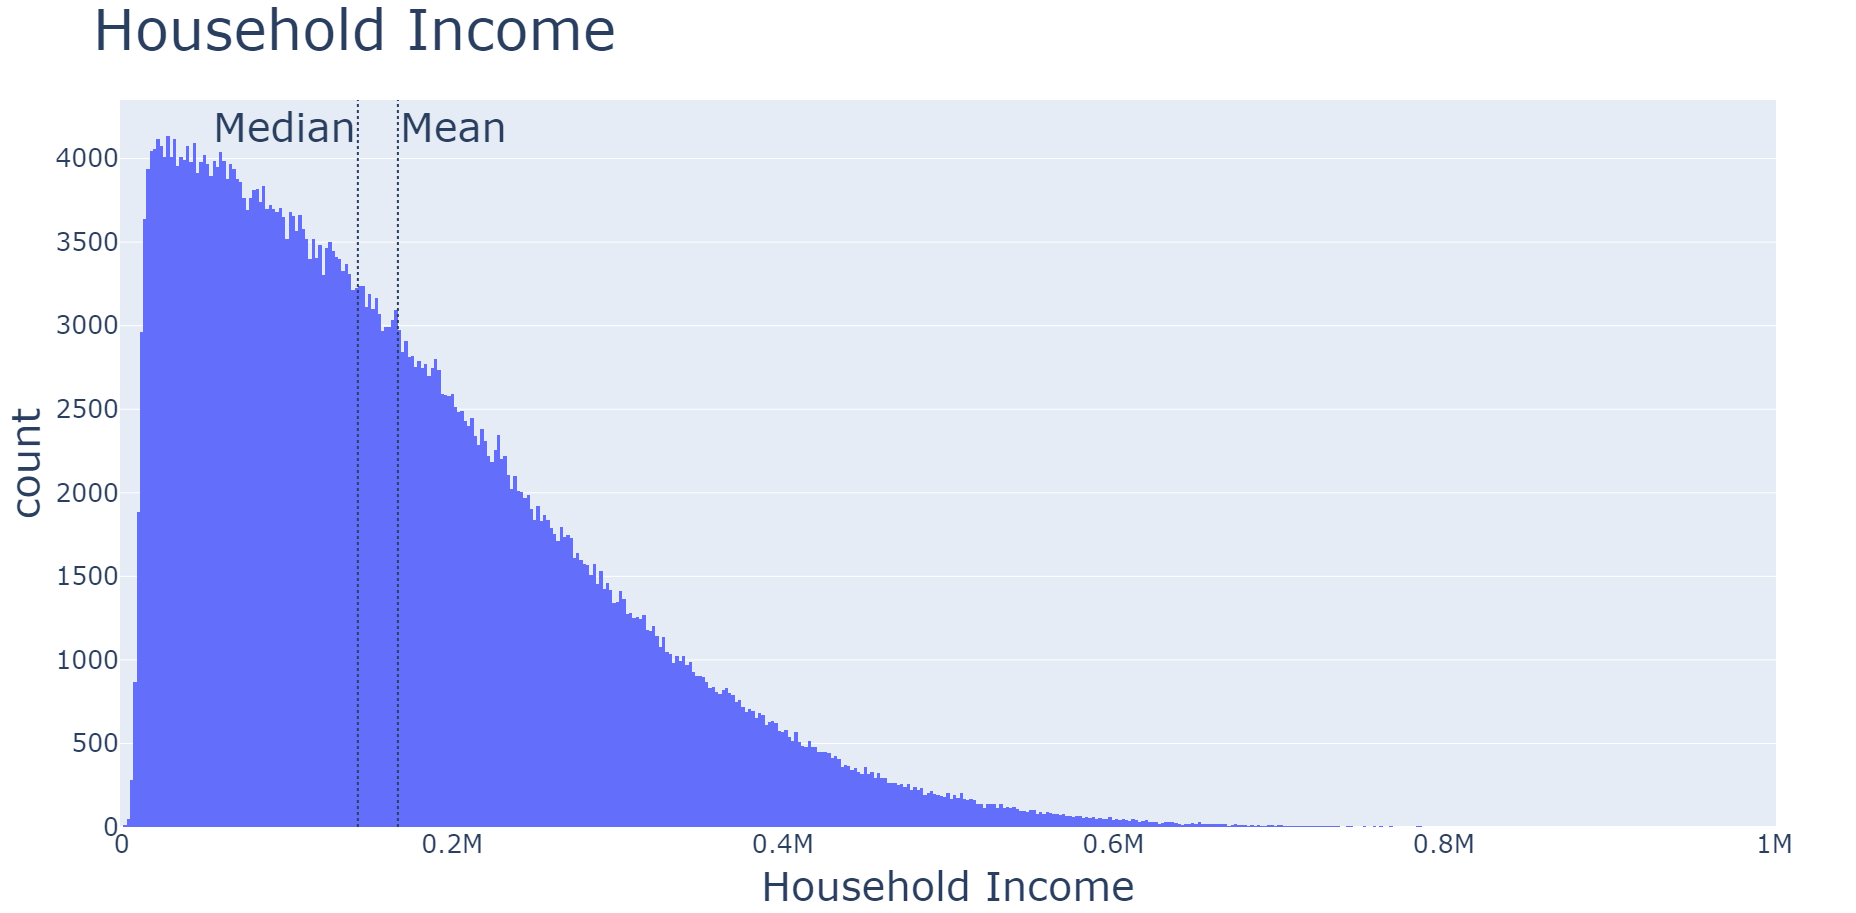
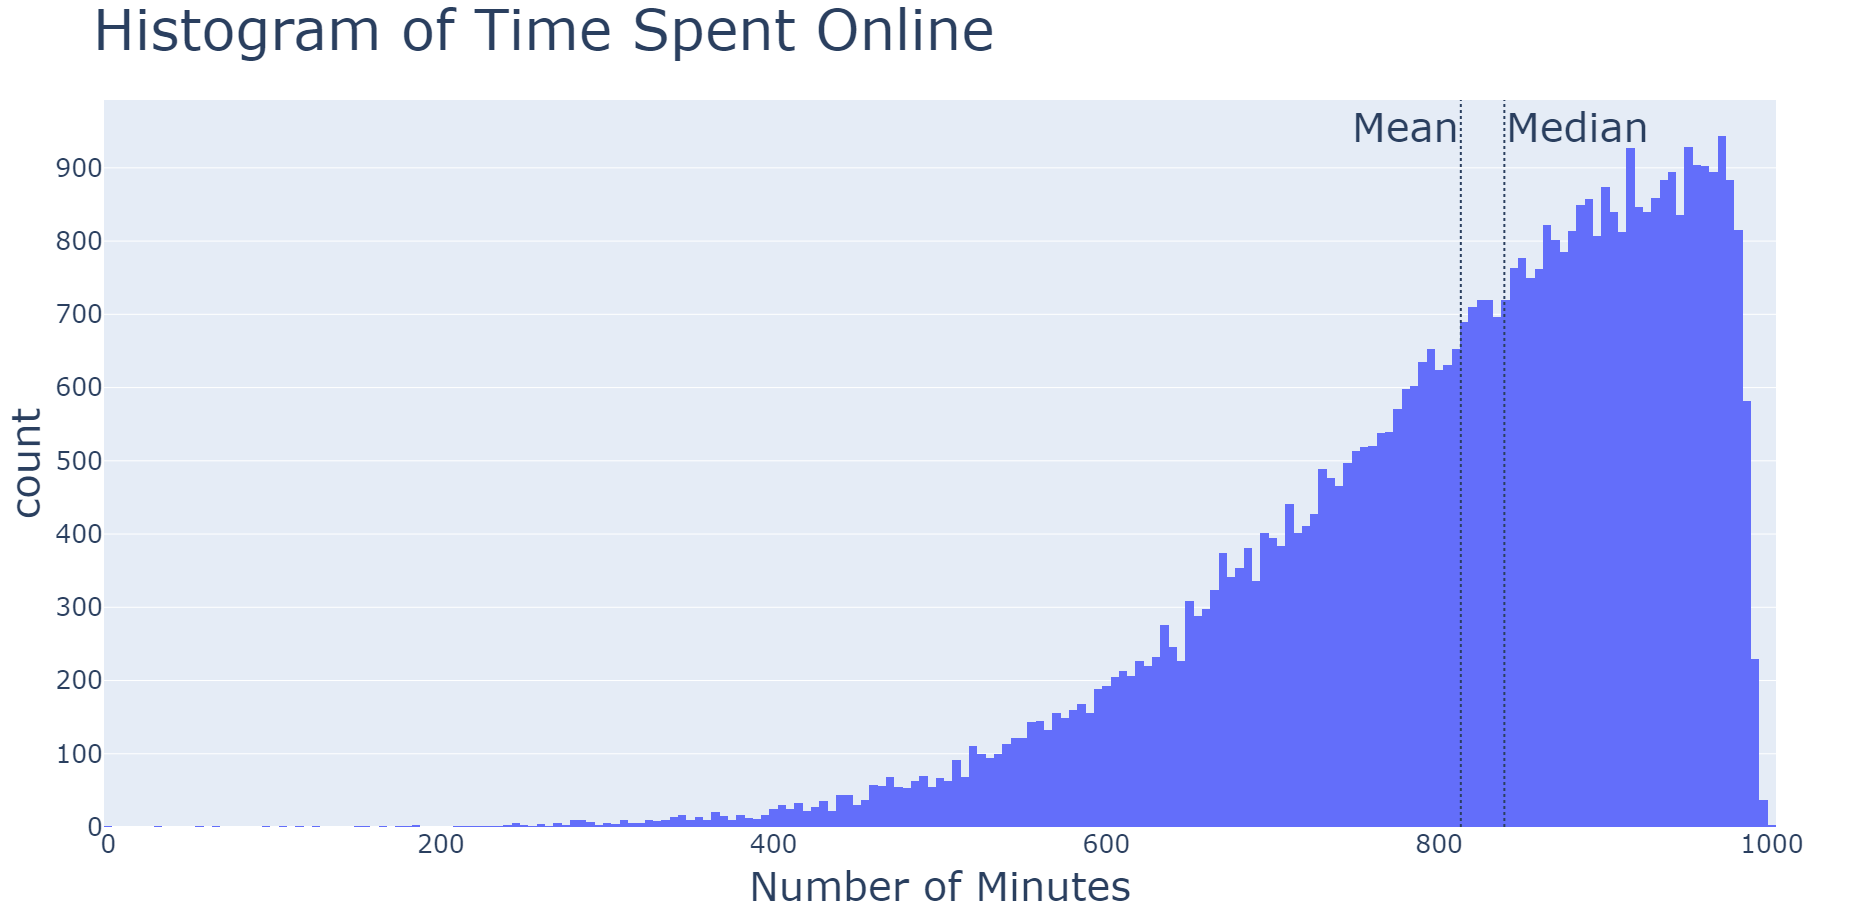
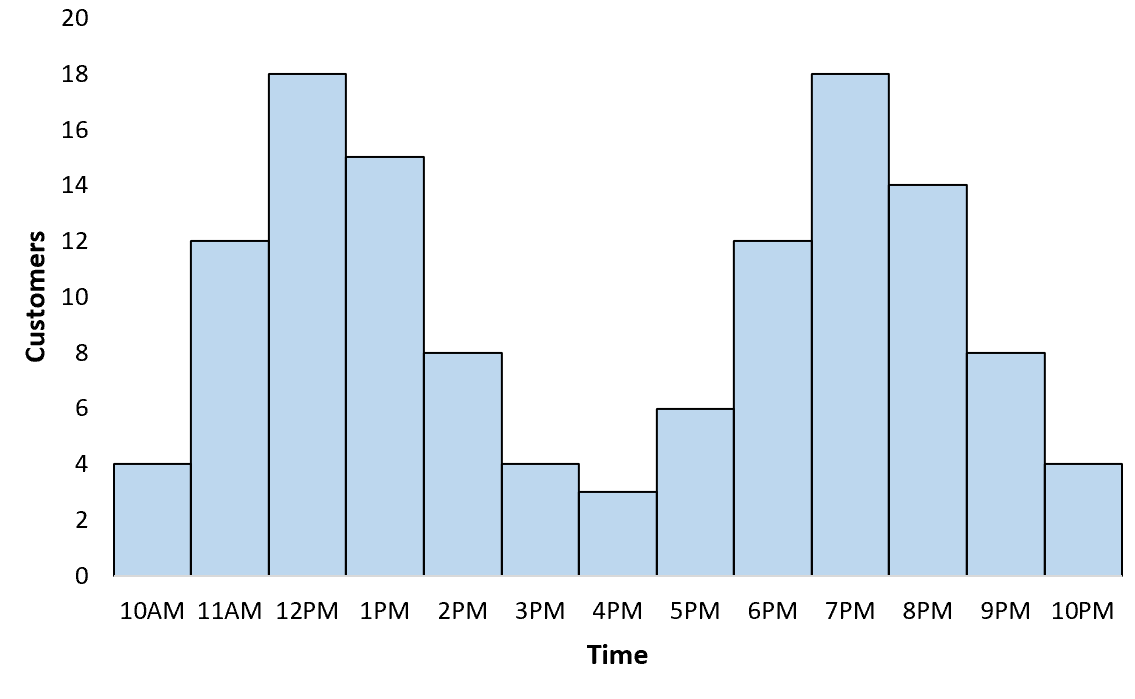
Histogrammen
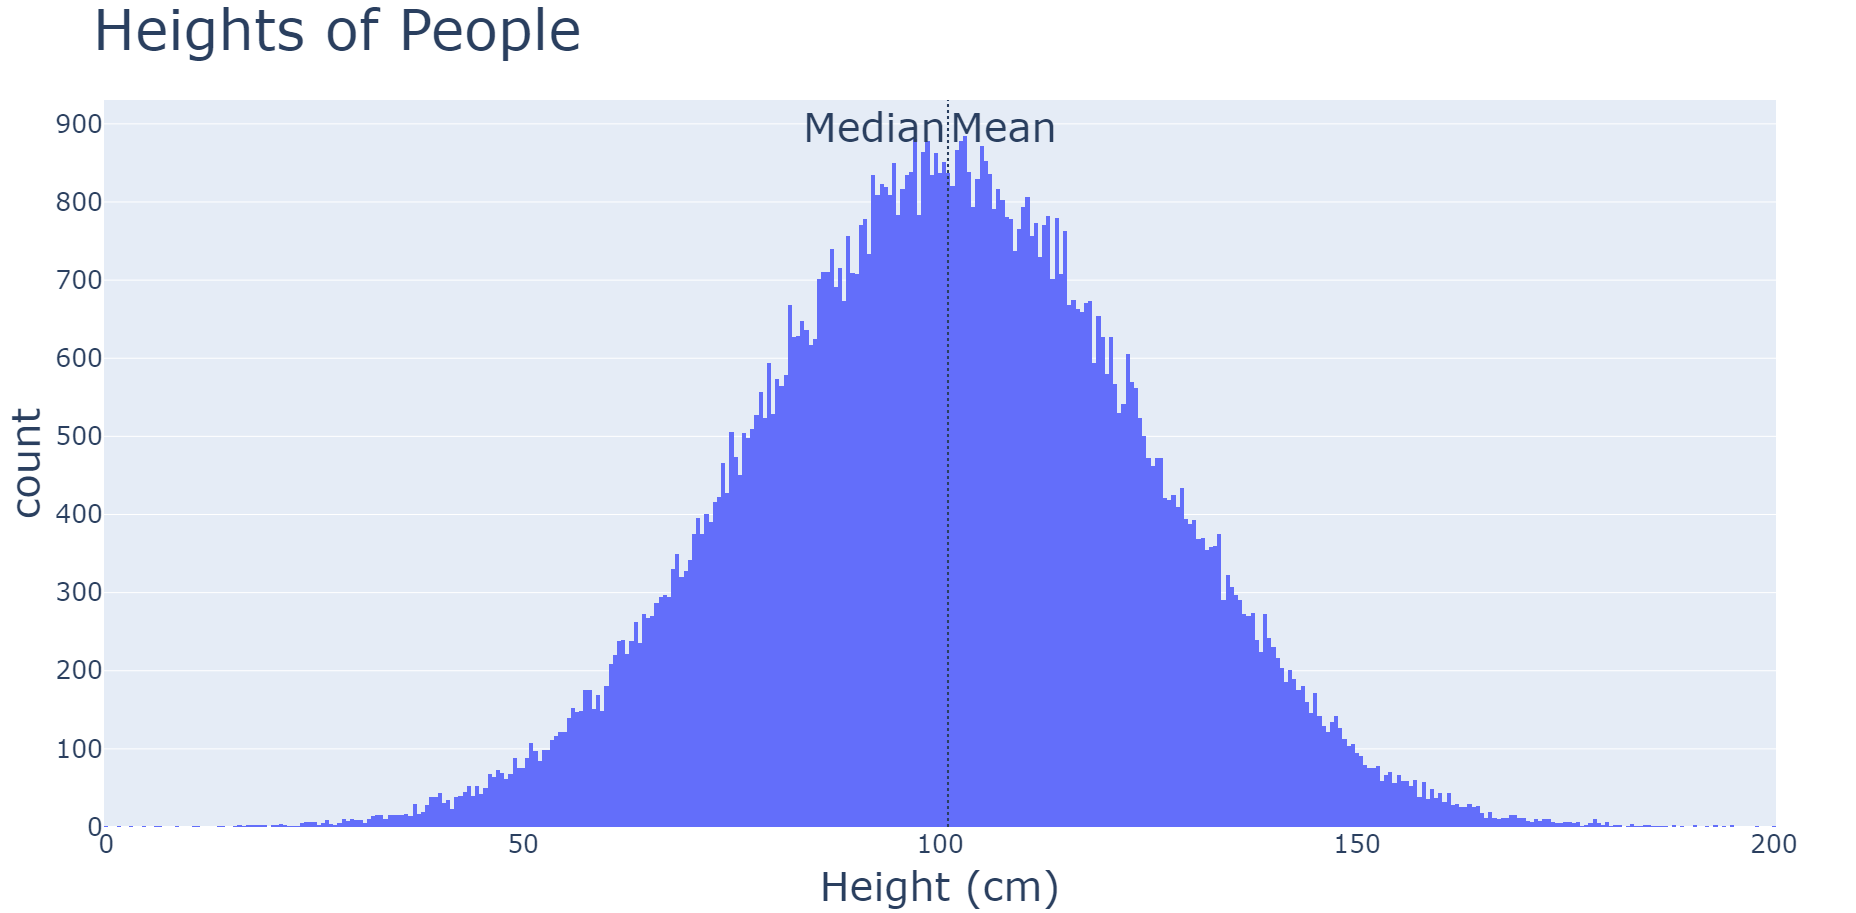
1 https://seaborn.pydata.org/generated/seaborn.histplot.html
Een histogram lezen
Een histogram lezen
Een histogram lezen
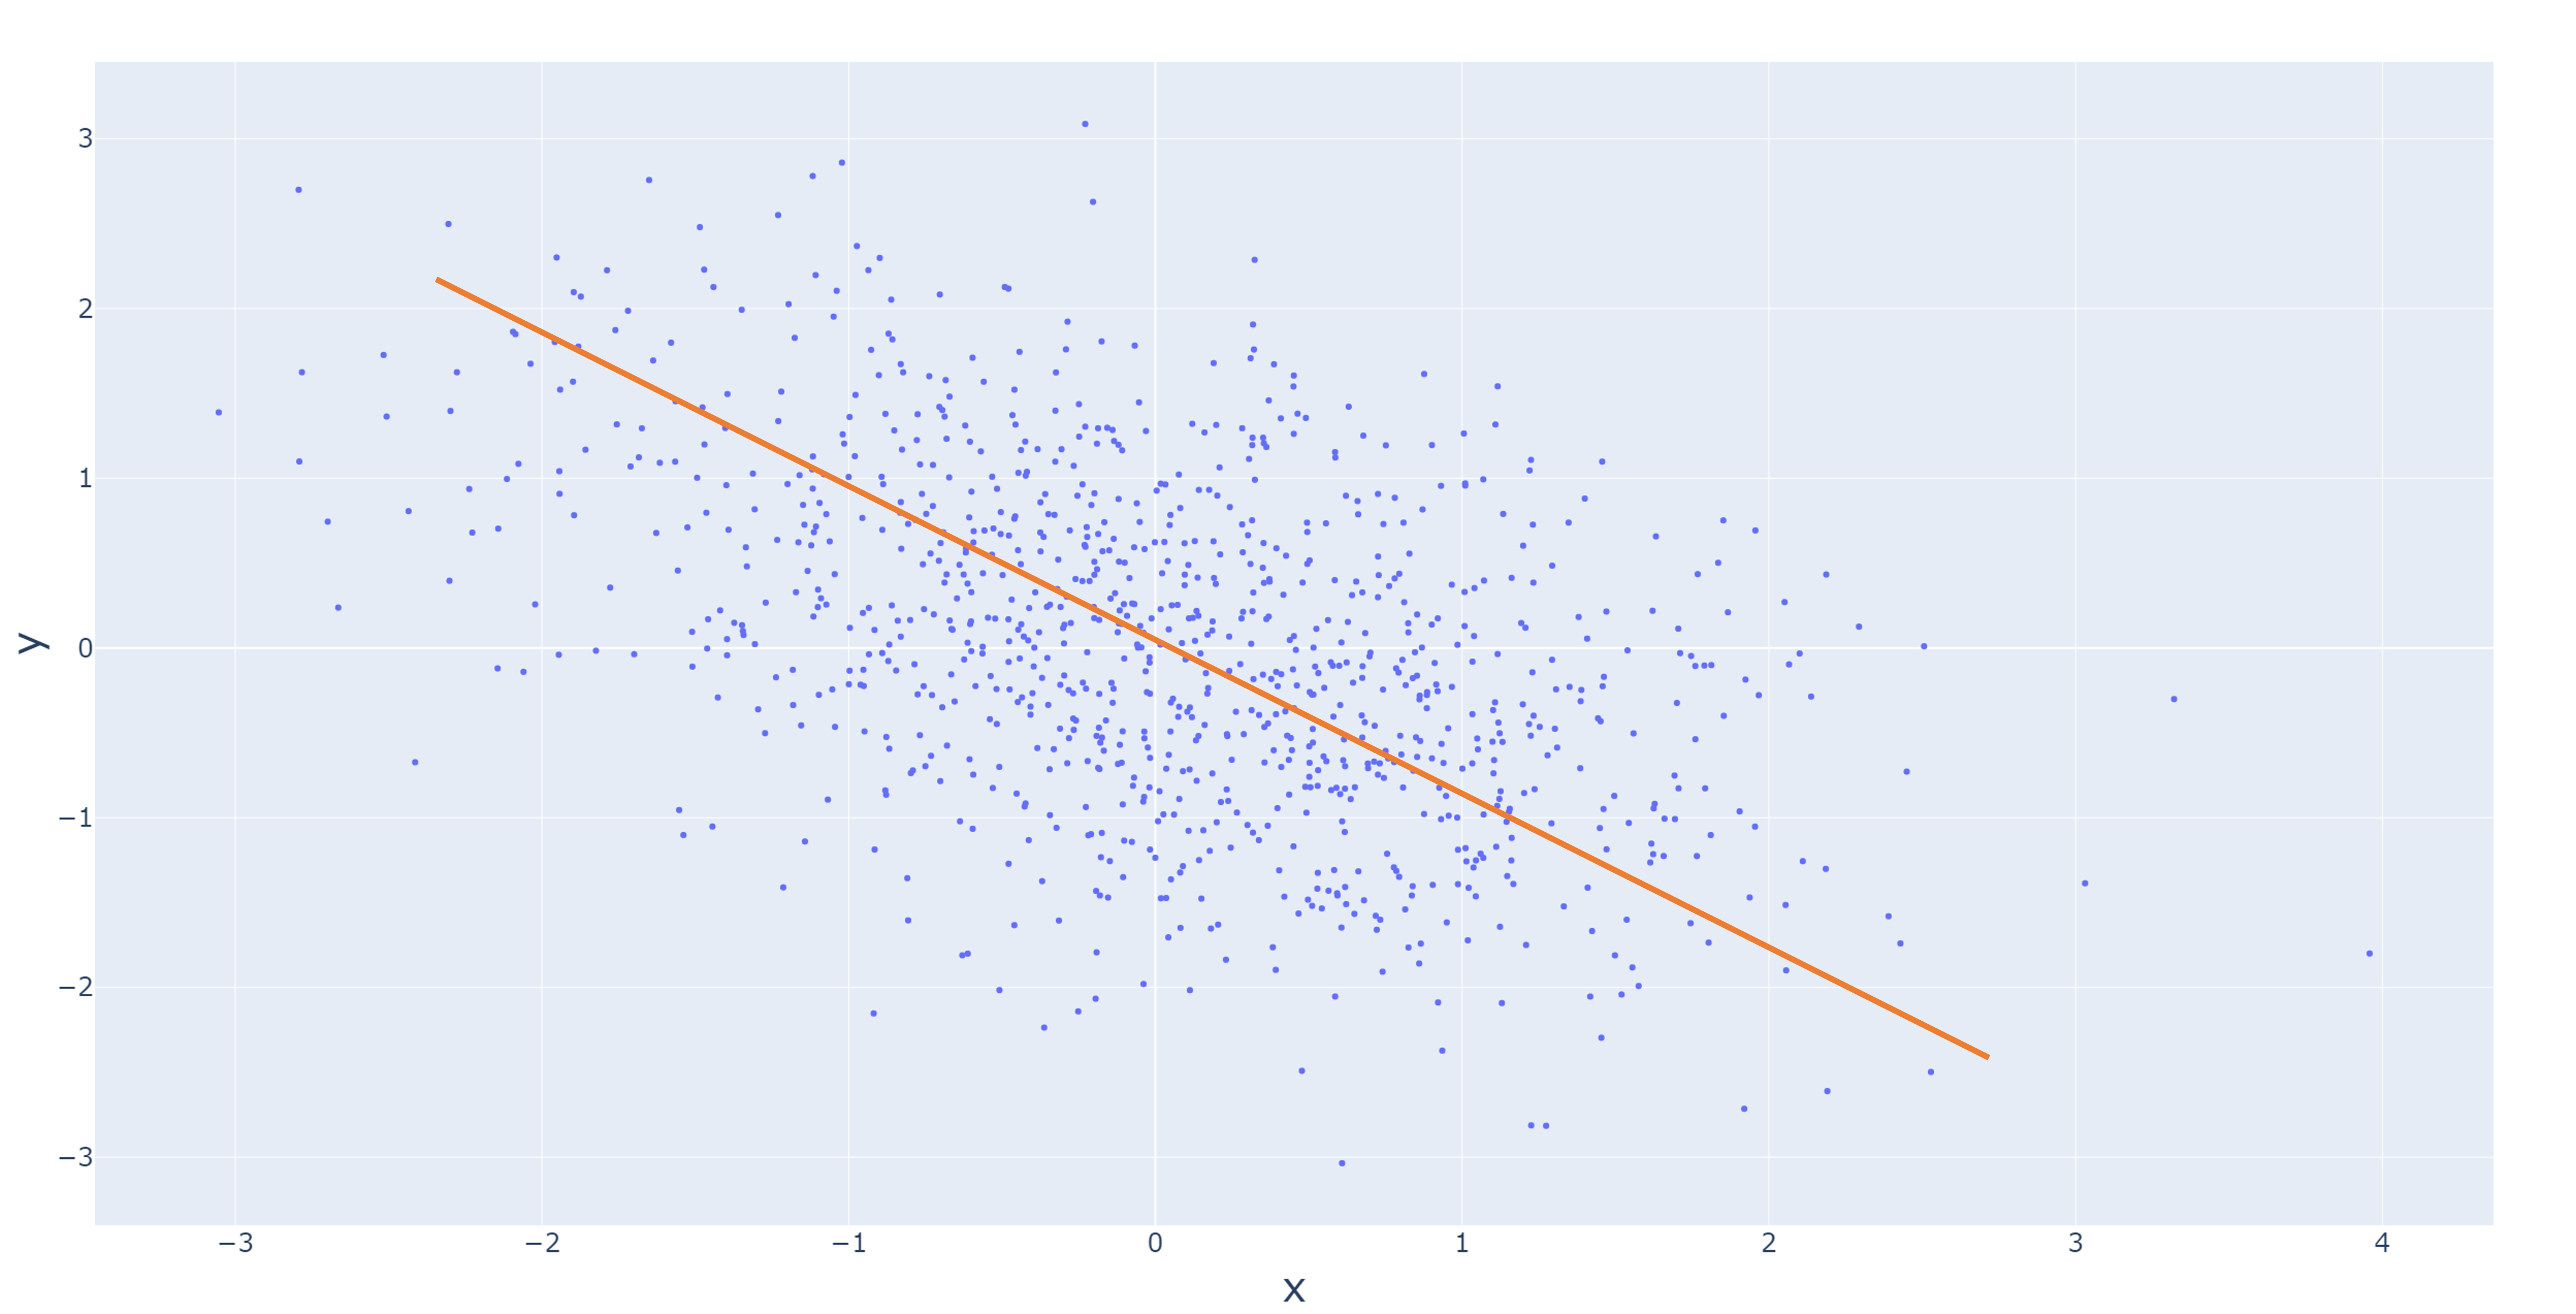
Spreidingsdiagrammen
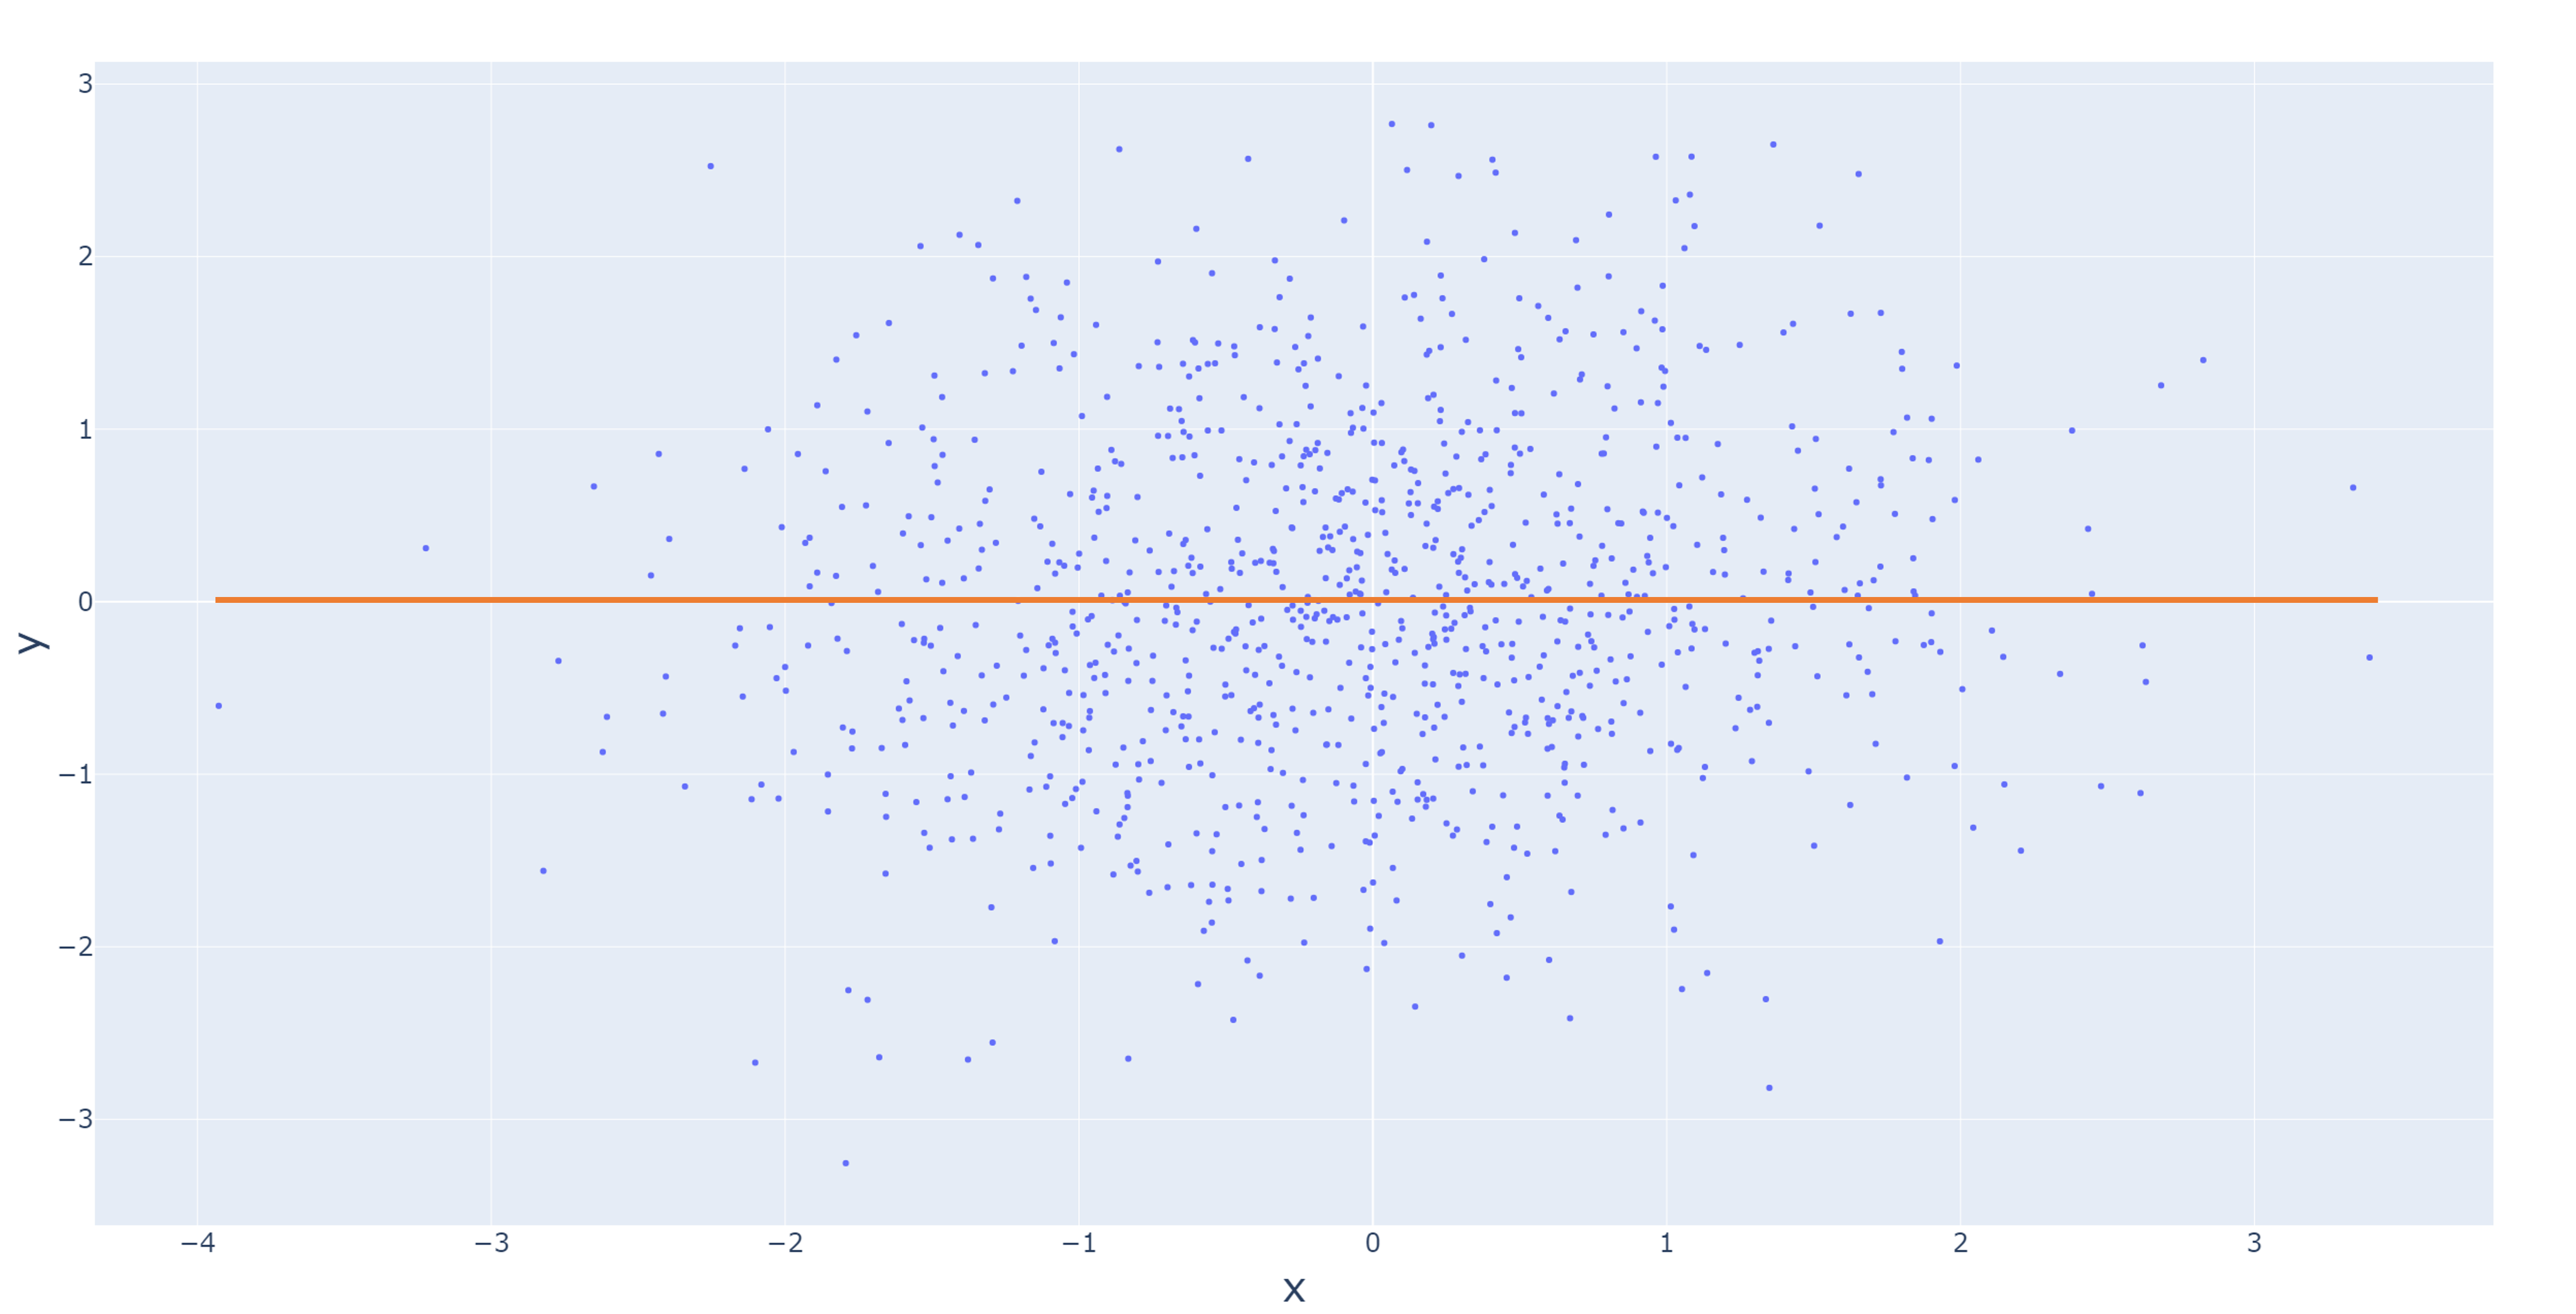
Spreidingsdiagrammen lezen
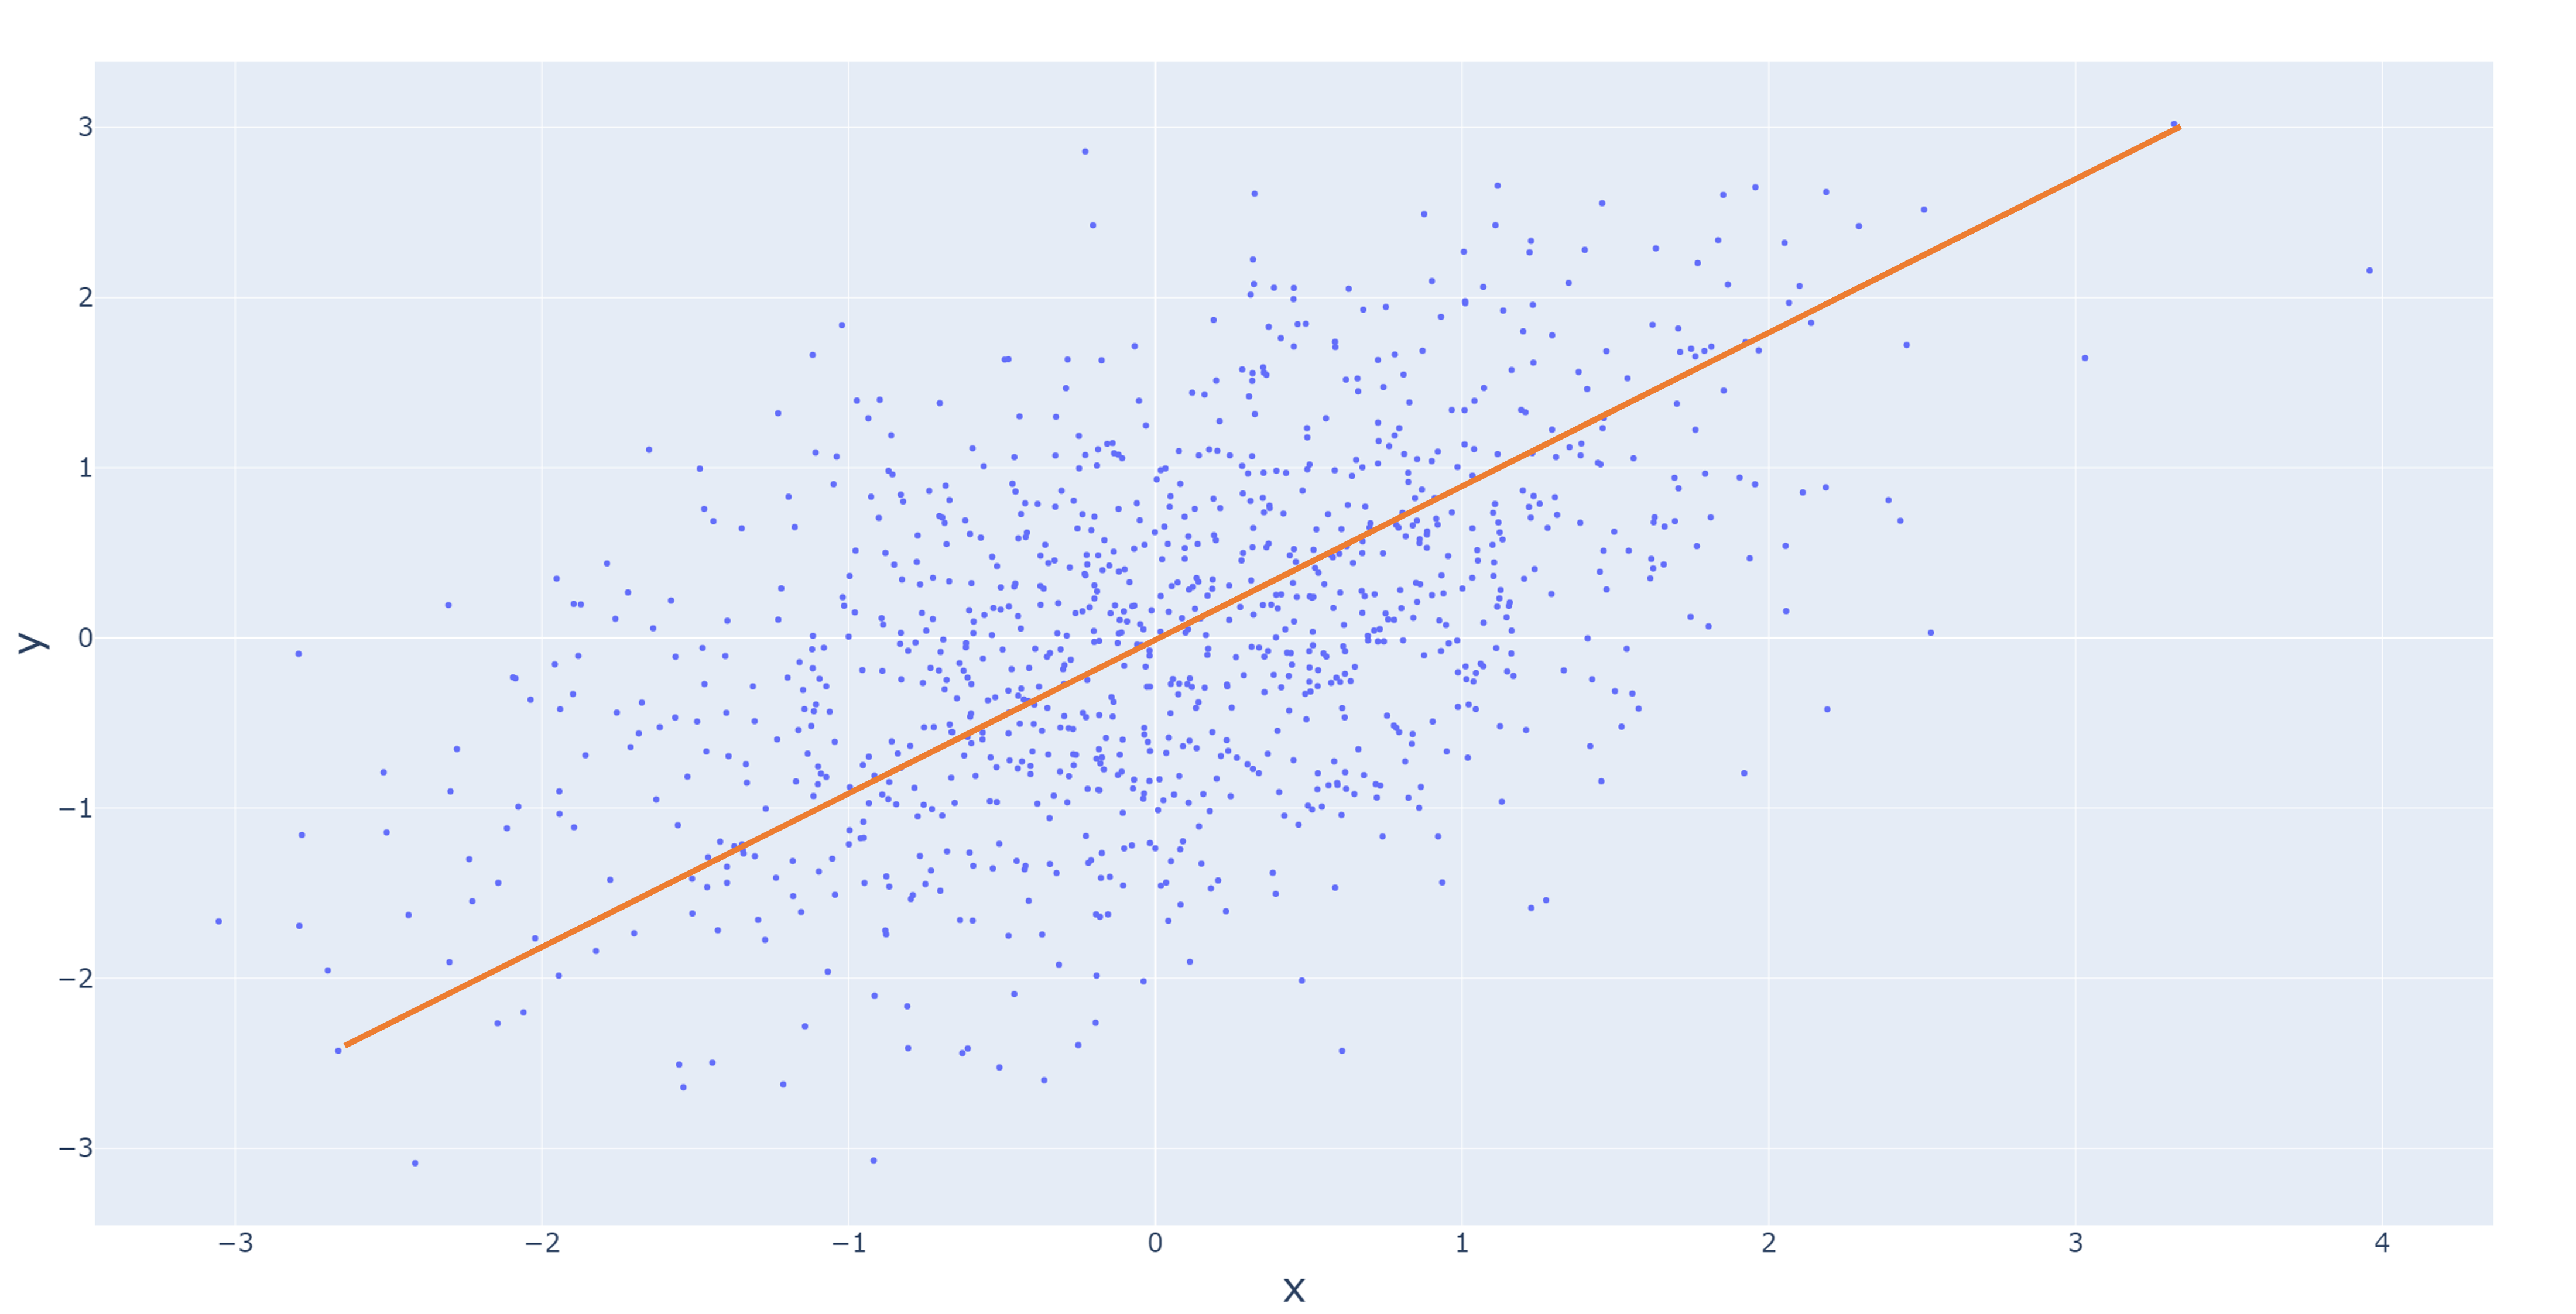
Spreidingsdiagrammen lezen
Jointplots
Pairplots

