Model fit beoordelen
Modelleren met tidymodels in R

David Svancer
Data Scientist
Binaire classificatie
Uitkomstvariabele met twee niveaus
- Positieve klasse
- Gebeurtenis van interesse om te voorspellen
- "yes" in variabele
purchased
Negatieve klasse
- "no"
In
tidymodelsmoet de uitkomst een factor zijn- Eerste niveau is de positieve klasse
- Controleer de volgorde met
levels()
leads_df
# A tibble: 1,328 x 7
  purchased total_visits  ...   us_location
   <fct>        <dbl>     ...     <fct>
 1 yes            7       ...     west
 2 no             8       ...     west
 3 no             5       ...     southeast
# ... with 1,325 more rows
levels(leads_df[['purchased']])
[1] "yes" "no"
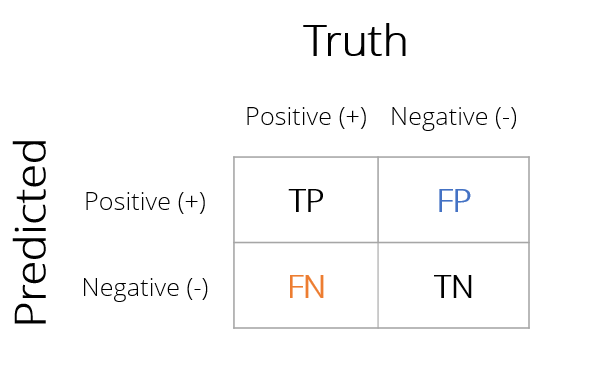
Confusion matrix
Matrix met tellingen van alle combinaties van echte en voorspelde uitkomsten
Correcte voorspellingen
- True Positive (TP)
- True Negative (TN)
Classificatiefouten
- False Positive (FP)
- False Negative (FN)
Classificatiemetrieken met yardstick
Confusion matrices en andere model-fit-metrieken maken met yardstick
- Vereist een tibble met modelresultaten met:
- Echte uitkomsten
purchased
- Voorspelde categorieën
.pred_class
- Geschatte kansen per categorie
.pred_yes.pred_no
- Echte uitkomsten
leads_results
# A tibble: 332 x 4
   purchased .pred_class .pred_yes .pred_no
   <fct>     <fct>           <dbl>    <dbl>
 1 no        no             0.134     0.866
 2 yes       yes            0.729     0.271
 3 no        no             0.133     0.867
 4 no        no             0.0916    0.908
 5 yes       yes            0.598     0.402
 6 no        no             0.128     0.872
 7 yes       no             0.112     0.888
 8 no        no             0.169     0.831
 9 no        no             0.158     0.842
10 yes       yes            0.520     0.480
# ... with 322 more rows
Confusion matrix met yardstick
De functie conf_mat()
- Tibble met modelresultaten
truth- kolom met echte uitkomstenestimate- kolom met voorspelde uitkomsten
Logistische regressie op leads_df
- 252 van 332 klanten correct geclassificeerd (76%)
- 46 false negatives
- 34 false positives
conf_mat(leads_results,truth = purchased,estimate = .pred_class)
Truth
Prediction yes no
yes 74 34
no 46 178
Classificatienauwkeurigheid
De functie accuracy()
- Neemt dezelfde argumenten als
conf_mat() - Berekent classificatienauwkeurigheid
$$\frac{TP + TN}{TP + TN + FP + FN}$$
yardstick-functies geven altijd een tibble terug.metric- type metriek.estimate- berekende waarde
accuracy(leads_results,
truth = purchased,
estimate = .pred_class)
# A tibble: 1 x 3
.metric .estimator .estimate
<chr> <chr> <dbl>
1 accuracy binary 0.759
Sensitiviteit
In veel gevallen is nauwkeurigheid niet de beste metriek
- Data
leads_df- Alles als 'no' classificeren geeft 64% nauwkeurigheid
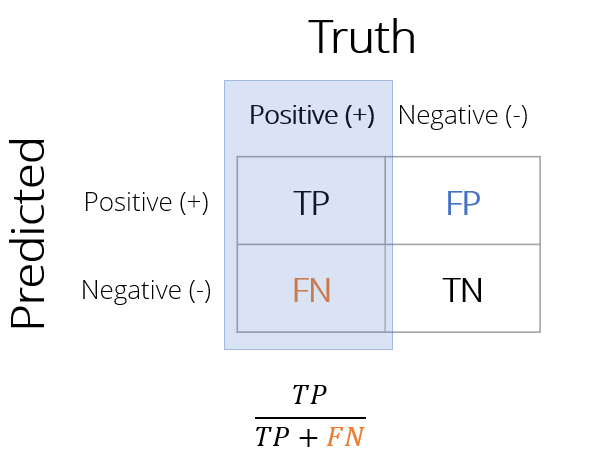
Sensitiviteit
Aandeel van alle positieve gevallen dat correct is geclassificeerd
- Van klanten die wél kochten: welk aandeel voorspelde het model correct?
- Minder false negatives verhoogt sensitiviteit
Sensitiviteit berekenen
De functie sens()
- Neemt dezelfde argumenten als
conf_mat()enaccuracy() - Geeft sensitiviteit in de kolom
.estimate
sens(leads_results,
truth = purchased,
estimate = .pred_class)
# A tibble: 1 x 3
.metric .estimator .estimate
<chr> <chr> <dbl>
1 sens binary 0.617
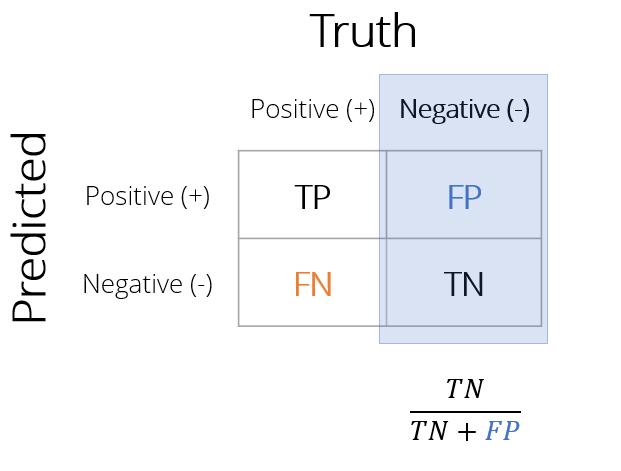
Specificiteit
Specificiteit is het aandeel van alle negatieve gevallen dat correct is geclassificeerd
- Van klanten die niet kochten: welk aandeel voorspelde het model correct?
- Minder false positives verhoogt specificiteit
1 - Specificiteit
- Ook wel de false positive rate (FPR)
- Aandeel false positives onder echte negatieven
Specificiteit berekenen
De functie spec()
- Neemt dezelfde argumenten als
sens() - Geeft specificiteit in de kolom
.estimate
spec(leads_results,
truth = purchased,
estimate = .pred_class)
# A tibble: 1 x 3
.metric .estimator .estimate
<chr> <chr> <dbl>
1 spec binary 0.840
Een metriekset maken
Eigen metrieksets
- Functie
metric_set()- Maakt een eigen metriekfunctie met geselecteerde
yardstick-metrieken - Geef namen van
yardstick-metriekfuncties door aanmetric_set() - Gebruik de aangepaste functie om metrieken te berekenen
- Maakt een eigen metriekfunctie met geselecteerde
custom_metrics <-
metric_set(accuracy, sens, spec)
custom_metrics(leads_results,
truth = purchased,
estimate = .pred_class)
# A tibble: 3 x 3
.metric .estimator .estimate
<chr> <chr> <dbl>
1 accuracy binary 0.759
2 sens binary 0.617
3 spec binary 0.840
Veel metrieken
Binaire classificatiemetrieken
Veel soorten binaire classificatiemetrieken
accuracy(),kap(),sens(),spec(),ppv(),npv(),mcc(),j_index(),bal_accuracy(),detection_prevalence(),precision(),recall(),f_meas()
Geef de resultaten van
conf_mat()door aansummary()om alles te berekenen
conf_mat(leads_results,

         truth = purchased,

estimate = .pred_class) %>%
summary()
# A tibble: 13 x 3
   .metric              .estimator .estimate
   <chr>                <chr>          <dbl>
 1 accuracy             binary         0.759
 2 kap                  binary         0.466
 3 sens                 binary         0.617
 4 spec                 binary         0.840
 5 ppv                  binary         0.685
 6 npv                  binary         0.795
 7 mcc                  binary         0.468
 8 j_index              binary         0.456
 9 bal_accuracy         binary         0.728
10 detection_prevalence binary         0.325
11 precision            binary         0.685
12 recall               binary         0.617
13 f_meas               binary         0.649
Laten we oefenen!
Modelleren met tidymodels in R

