Classificatiemodellen
Modelleren met tidymodels in R

David Svancer
Data Scientist
Productaankopen voorspellen
Classificatiemodellen voorspellen categorische uitkomsten
- Voorspellen van productaankopen
| purchased | total_time | total_visits |
|---|---|---|
| yes | 800 | 3 |
| yes | 978 | 7 |
| no | 220 | 4 |
| no | 124 | 5 |
| yes | 641 | 4 |
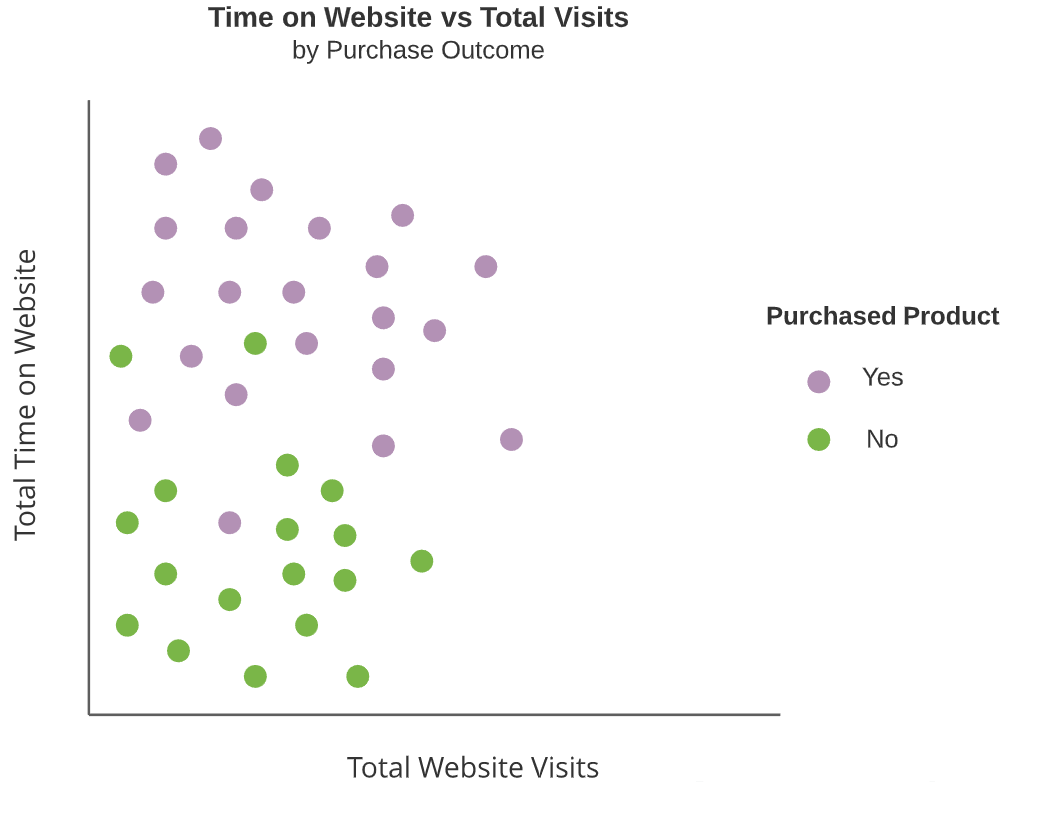
Classificatie-algoritmen
Doel: Maak duidelijke, niet-overlappende regio’s over waarden van predictorvariabelen
- Voorspel in elke regio dezelfde categorische uitkomst
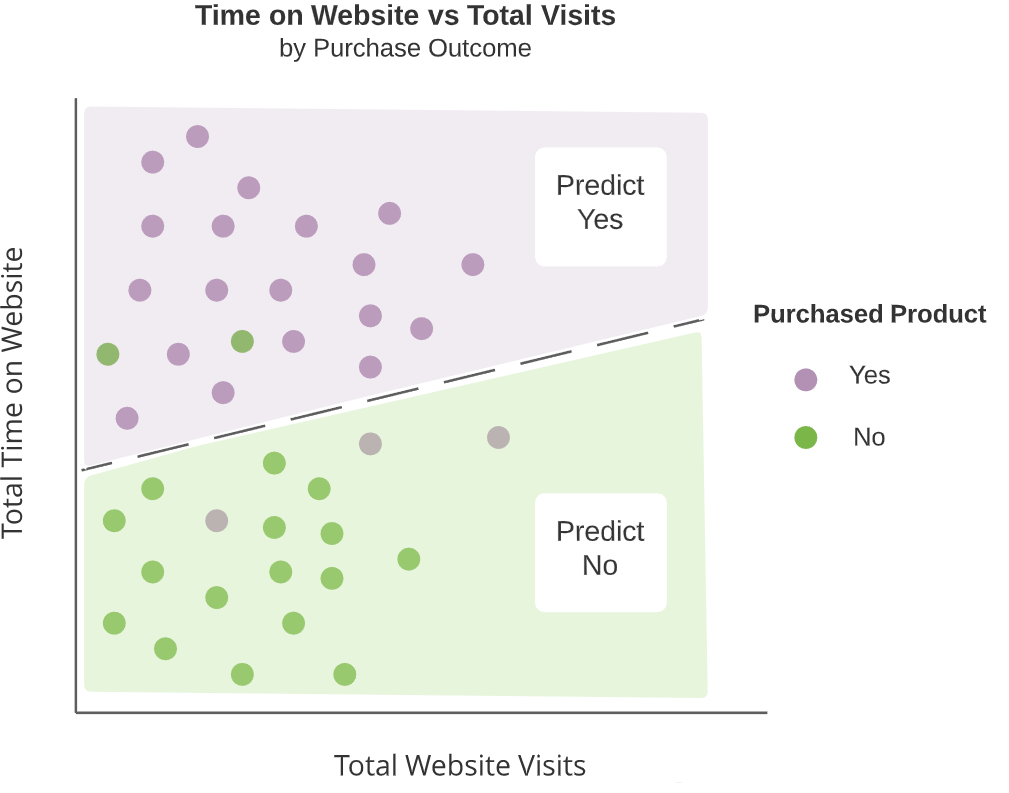
Classificatie-algoritmen
Doel: Maak duidelijke, niet-overlappende regio’s over waarden van predictorvariabelen
- Voorspel in elke regio dezelfde categorische uitkomst
Logistische regressie
- Populair classificatie-algoritme dat een lineaire scheiding tussen categorieën maakt
Lead-scoringdata
leads_df
# A tibble: 1,328 x 7
   purchased total_visits total_time pages_per_visit total_clicks lead_source    us_location
   <fct>            <dbl>      <dbl>           <dbl>        <dbl> <fct>          <fct>
 1 yes                  7       1148            7              59 direct_traffic west
 2 no                   8        100            2.67           24 direct_traffic west
 3 no                   5        228            2.5            25 email          southeast
 4 no                   7        481            2.33           21 organic_search west
 5 no                   4        177            4              37 direct_traffic west
 6 no                   2       1273            2              26 email          midwest
 7 no                   3        711            3              28 organic_search west
 8 no                   3        166            3              32 direct_traffic southeast
 9 no                   3          7            3              23 organic_search west
10 no                   6        562            6              48 organic_search southeast
# ... with 1,318 more rows
Dataresampling
Eerste stap voor modeltraining
- Maak een datasplit met
initial_split() - Maak train- en testsets met
training()entesting()
leads_split <- initial_split(leads_df, prop = 0.75, strata = purchased)leads_training <- leads_split %>% training()leads_test <- leads_split %>% testing()
Specificatie logistische regressie
Modelspecificatie in parsnip
logistic_reg()- Algemene interface voor logistische regressie in
parsnip - Gebruikelijke engine: 'glm'
- Modus: 'classification'
- Algemene interface voor logistische regressie in
logistic_model <- logistic_reg() %>%set_engine('glm') %>%set_mode('classification')
Model fitten
Na specificatie train je met fit()
- Geef het modelobject aan
fit() - Specificeer de modelformule
- Lever trainingsdata via
data
logistic_fit <- logistic_model %>%fit(purchased ~ total_visits + total_time,data = leads_training)
Uitkomstcategorieën voorspellen
De functie predict()
new_datageeft de dataset voor nieuwe voorspellingentype'class'geeft categorische voorspellingen
Gestandaardiseerde output van predict()
- Geeft een tibble
- Bij
type = 'class'een factor-kolom.pred_class
class_preds <- logistic_fit %>%predict(new_data = leads_test,type = 'class')class_preds
# A tibble: 332 x 1
   .pred_class
   <fct>
 1 no
 2 yes
 3 no
 4 no
 5 yes
 # ... with 327 more rows
Geschatte kansen
Met type = 'prob' krijg je geschatte kansen per uitkomstcategorie
predict() retourneert dan een tibble met meerdere kolommen
- Eén per categorie van de uitkomstvariabele
- Namen volgen
.pred_{outcome_category}
prob_preds <- logistic_fit %>%
  predict(new_data = leads_test,
          type = 'prob')

prob_preds
# A tibble: 332 x 2
   .pred_yes .pred_no
       <dbl>    <dbl>
 1    0.134     0.866
 2    0.729     0.271
 3    0.133     0.867
 4    0.0916    0.908
 5    0.598     0.402
# ... with 327 more rows
Resultaten combineren
Voor modelevaluatie met het yardstick-pakket heb je een result-tibble nodig
Combineer de uitkomstvariabele uit de testset en de predictie-tibbles met bind_cols()
leads_results <- leads_test %>%
  select(purchased) %>%
  bind_cols(class_preds, prob_preds)
leads_results
# A tibble: 332 x 4
   purchased .pred_class .pred_yes .pred_no
   <fct>     <fct>           <dbl>    <dbl>
 1 no        no             0.134     0.866
 2 yes       yes            0.729     0.271
 3 no        no             0.133     0.867
 4 no        no             0.0916    0.908
 5 yes       yes            0.598     0.402
# ... with 327 more rows
Telecomgegevens
telecom_df
# A tibble: 975 x 9
   canceled_service cellular_service avg_data_gb avg_call_mins avg_intl_mins internet_service   contract    months_with_company monthly_charges
   <fct>            <fct>               <dbl>         <dbl>        <dbl>         <fct>           <fct>               <dbl>           <dbl>
 1 yes              single_line         7.78           497         127         fiber_optic     month_to_month         7              76.4
 2 yes              single_line         9.04           336         88          fiber_optic     month_to_month         10             94.9
 3 no               single_line         10.3           262         55          fiber_optic     one_year               50             103.
 4 yes              multiple_lines      5.08           250         107         digital         one_year               53             60.0
 5 no               multiple_lines      8.05           328         122         digital         two_year               50             75.2
 6 no               single_line         9.3            326         114         fiber_optic     month_to_month         25             95.7
 7 yes              multiple_lines      8.01           525         97          fiber_optic     month_to_month         19             83.6
 8 no               multiple_lines      9.4            312         147         fiber_optic     one_year               50             99.4
 9 yes              single_line         5.29           417         96          digital         month_to_month         8              49.8
10 no               multiple_lines      9.96           340         136         fiber_optic     month_to_month         61             106.
# ... with 965 more rows
Laten we oefenen!
Modelleren met tidymodels in R

