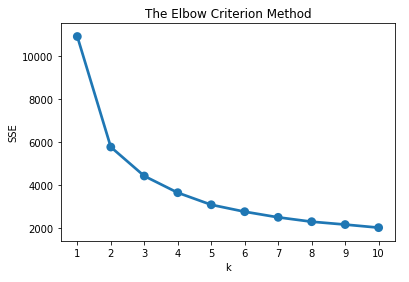
Aantal clusters kiezen
Klantsegmentatie in Python

Karolis Urbonas
Head of Data Science, Amazon
Elbow-criterium
De elbow-grafiek:
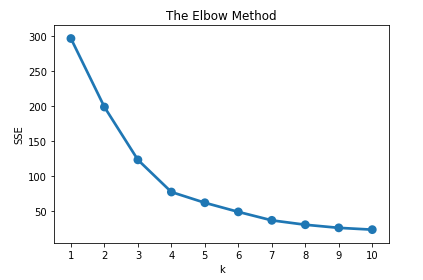
Elbow-criterium
De elbow-grafiek:
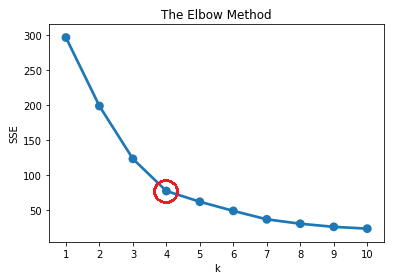
Elbow-criterium gebruiken
- Kies het punt op de elbow of het volgende punt
- Gebruik als richtlijn en test meerdere opties
- Elbow-plot gemaakt op
datamart_rfm
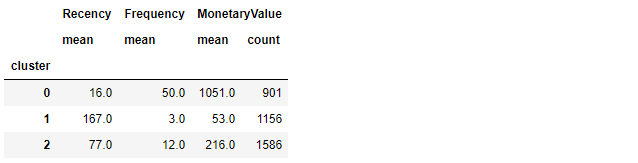
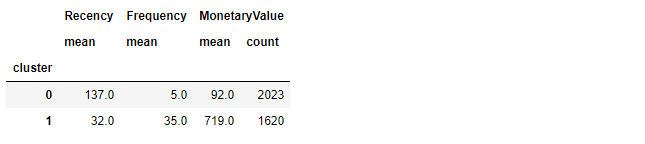
Experimentele aanpak - segmenten analyseren
- Vorige 2-clusteroplossing
- 3-clusteroplossing op dezelfde genormaliseerde RFM-dataset