Cohortanalyse visualiseren

Klantsegmentatie in Python

Karolis Urbonas

Head of Data Science, Amazon

Heatmap

  • Makkelijkste manier om cohortanalyse te tonen

  • Bevat data en visuals

  • Slechts paar regels code met seaborn

cohort_heatmap

Klantsegmentatie in Python

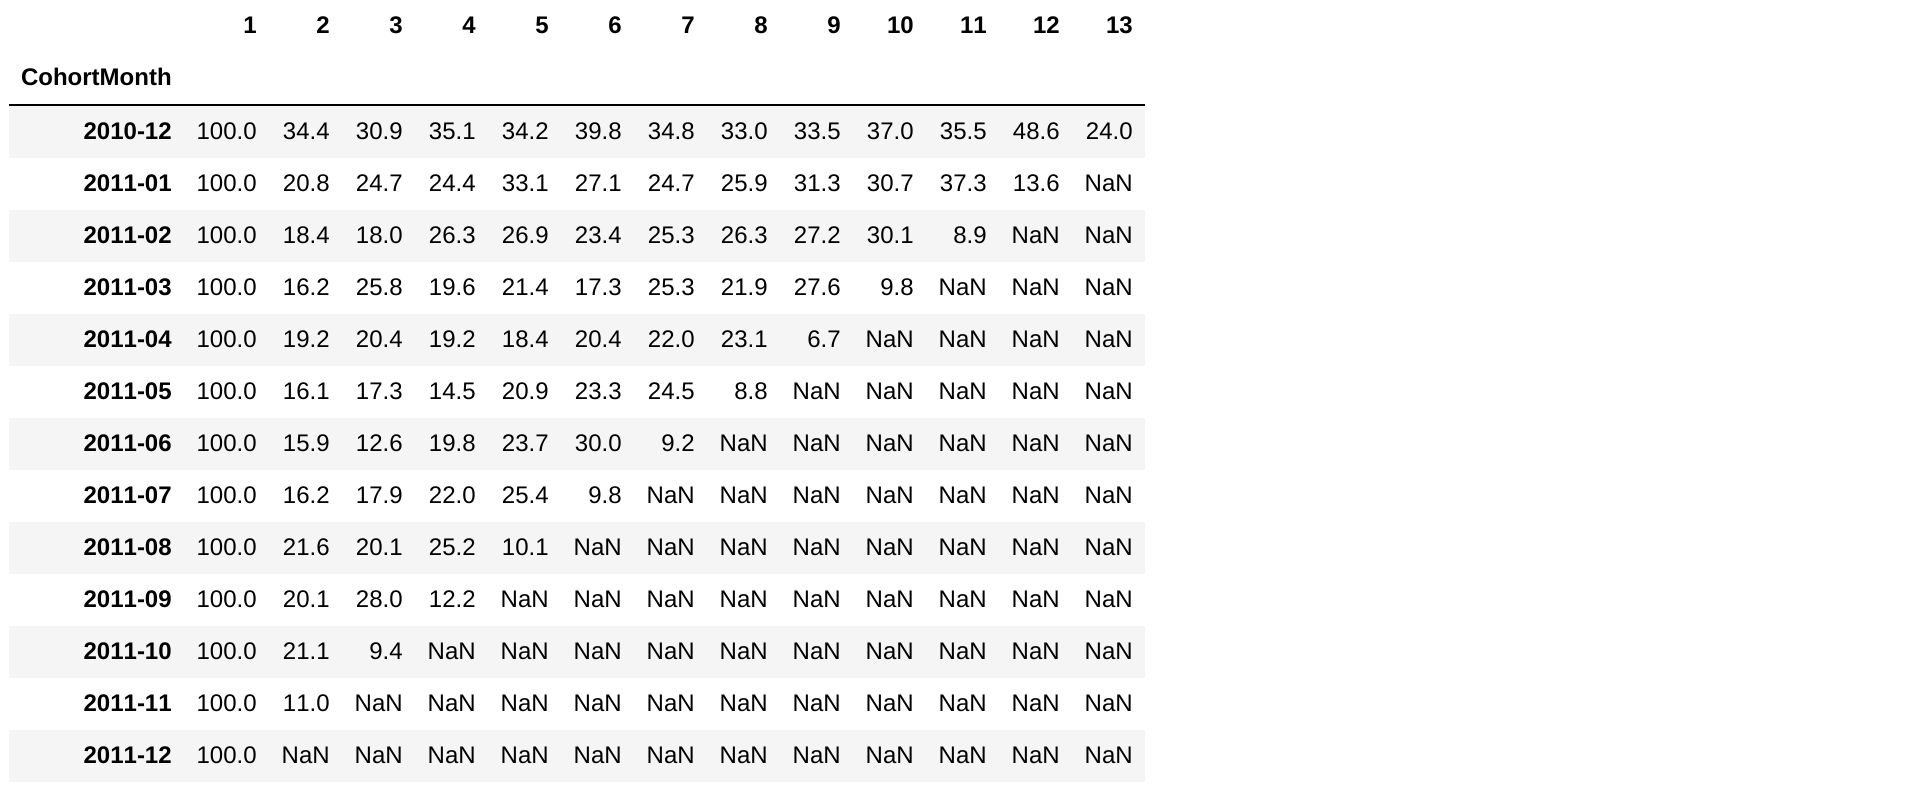
Laad de retentietabel

retention.round(3)*100
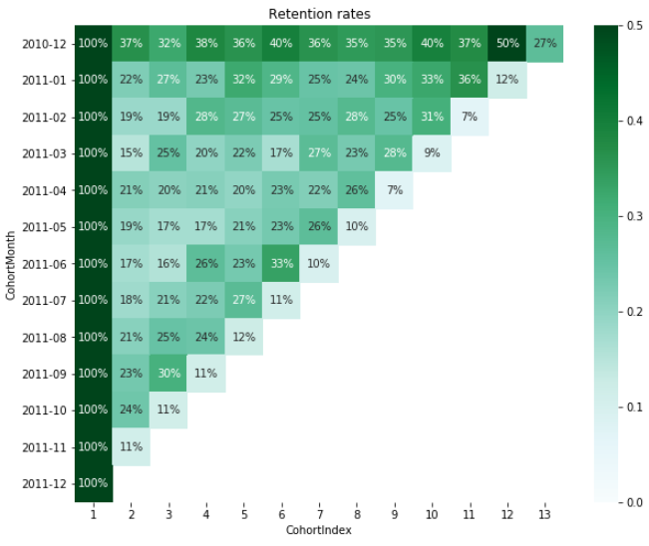
retention_table

Klantsegmentatie in Python

Maak de heatmap

import seaborn as sns
import matplotlib.pyplot as plt

plt.figure(figsize=(10, 8))
plt.title('Retention rates')
sns.heatmap(data = retention, annot = True, fmt = '.0%', vmin = 0.0, vmax = 0.5, cmap = 'BuGn')
plt.show()
Klantsegmentatie in Python

Retentie-heatmap

retention_heatmap

Klantsegmentatie in Python

Cohorten visualiseren: oefenen

Klantsegmentatie in Python

Preparing Video For Download...