Hersampelen als speciaal type Monte Carlo-simulatie

Monte Carlo-simulaties in Python

Izzy Weber

Curriculum Manager, DataCamp

Hersampelen als speciaal type Monte Carlo-simulatie


Monte Carlo-simulaties

  • Steekproeven uit kansverdelingen
  • Verdelingen zijn bekend of aangenomen
  • Kies verdelingen op basis van historische data of expertise


Hersampelen

  • Trek willekeurig uit bestaande data
  • Bestaande data is impliciete kansverdeling
  • Neem aan dat de data representatief is
Monte Carlo-simulaties in Python

Hersamplemethoden

  1. Zonder terugleggen (sampling without replacement)
    • Voor een willekeurige steekproef
  2. Met terugleggen (bootstrap)
    • Schat de steekproefverdeling van bijna elke statistiek
  3. Permutatie
    • Vaak om twee groepen te vergelijken
Monte Carlo-simulaties in Python

Steekproeven zonder terugleggen

Trek willekeurig twee verschillende staten uit de zes staten van New England

import random
def two_random_ne_states():

ne_states=["Maine", "Vermont", "New Hampshire", "Massachusetts", "Connecticut", "Rhode Island"]
return(random.sample(ne_states, 2))


two_random_ne_states()
['Massachusetts', 'Connecticut']
['New Hampshire', 'Maine']
Monte Carlo-simulaties in Python

Bootstrap

Schat het 95%-betrouwbaarheidsinterval voor de gemiddelde lengte van NBA-spelers

import random
import numpy as np

nba_heights = [196, 191, 198, 216, 188, 185, 211, 201,
               188, 191, 201, 208, 191, 183, 196]
simu_heights = []

for i in range(1000): bootstrap_sample = random.choices(nba_heights, k=15) simu_heights.append(np.mean(bootstrap_sample))
upper = np.quantile(simu_heights, 0.975) lower = np.quantile(simu_heights, 0.025) print([np.mean(simu_heights), lower, upper])
[196.26666666666668, 191.8, 201.2]
Monte Carlo-simulaties in Python

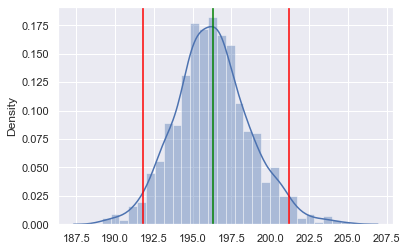
Visualisatie van bootstrapresultaten

Plotbibliotheken:

  • seaborn
  • matplotlib
import seaborn as sns
import matplotlib.pyplot as plt

sns.displot(simu_heights)
plt.axvline(191.8, color="red")
plt.axvline(201.2, color="red")
plt.axvline(196.3, color="green")


een verdelingsplot van gesimuleerde lengtes

Monte Carlo-simulaties in Python

Permutatie

Schat 95%-betrouwbaarheidsinterval van het gemiddelde verschil tussen NBA-lengtes en Amerikaanse mannen

us_heights = [165, 185, 179, 187, 193, 180, 178, 179, 171, 176, 
              169, 160, 140, 199, 176, 185, 175, 196, 190, 176]
nba_heights = [196, 191, 198, 216, 188, 185, 211, 201, 188, 191, 201, 208, 191, 183, 196]

all_heights = us_heights + nba_heights
simu_diff = [] for i in range(1000): perm_sample = np.random.permutation(all_heights) perm_nba, perm_adult = perm_sample[0:15], perm_sample[15:35]
perm_diff = np.mean(perm_nba) - np.mean(perm_adult) simu_diff.append(perm_diff)
Monte Carlo-simulaties in Python

Permutatieresultaten

Verschil in gemiddelde lengte van NBA-spelers vs. volwassen Amerikaanse mannen:

np.mean(nba_heights) - np.mean(us_adult_height)
18.31666666666669

95%-BI voor permutatie van twee willekeurige lijsten:

upper = np.quantile(simu_diff, 0.975)
lower = np.quantile(simu_diff, 0.025)
print([lower, upper])
[-10.033333333333331, 10.033333333333331]
Monte Carlo-simulaties in Python

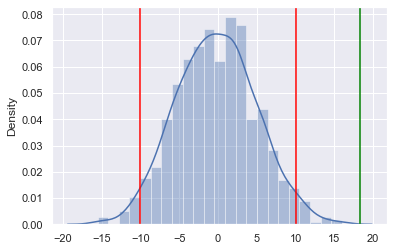
Permutatieresultaten visualiseren

sns.distplot(simu_diff)
plt.axvline(-10.03, color="red")
plt.axvline(10.03, color="red")
plt.axvline(18.32, color="green")

een verdelingsplot van gesimuleerde lengtes

Monte Carlo-simulaties in Python

Laten we oefenen!

Monte Carlo-simulaties in Python

Preparing Video For Download...