Validatie van GARCH-modelaannames

GARCH-modellen in Python

Chelsea Yang

Data Science Instructor
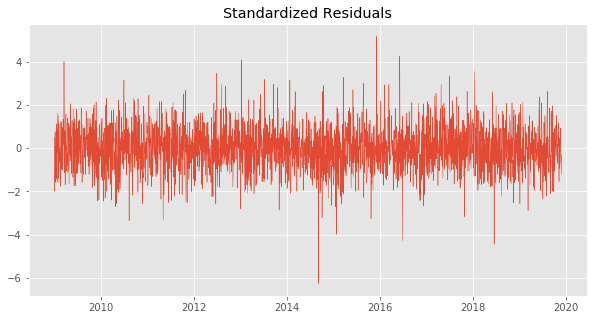
Visuele check

Ruwe rendementen

Gestandaardiseerde residuen

GARCH-modellen in Python

Autocorrelatie

  • Beschrijft de correlatie van een variabele met zichzelf bij een tijdsvertraging

  • Autocorrelatie in de gestandaardiseerde residuen duidt op een mogelijk slecht model

Autocorrelatie detecteren:

  • ACF-plot
  • Ljung-Box
GARCH-modellen in Python

ACF-plot

  • ACF: AutoCorrelation Function
  • ACF-plot: visuele weergave van autocorrelatie per lag

ACF-plot

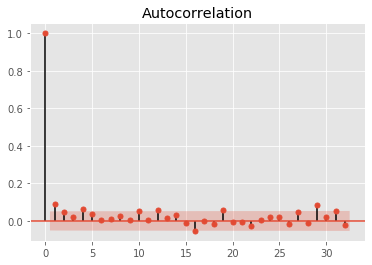
Rood gebied geeft het betrouwbaarheidsniveau aan (alpha = 5%)

GARCH-modellen in Python

ACF-plot in Python

from statsmodels.graphics.tsaplots import plot_acf

plot_acf(my_data, alpha = 0.05)
GARCH-modellen in Python

Ljung-Box-toets

  • Test of een set autocorrelaties van een tijdreeks afwijkt van nul
  • H0: de data is onafhankelijk verdeeld
  • P-waarde < 5%: het model is niet valide
GARCH-modellen in Python

Ljung-Box-toets in Python

# Import the Python module
from statsmodels.stats.diagnostic import acorr_ljungbox
# Perform the Ljung-Box test
lb_test = acorr_ljungbox(std_resid , lags = 10)
# Check p-values
print('P-values are: ', lb_test[1])
GARCH-modellen in Python

Laten we oefenen!

GARCH-modellen in Python

Preparing Video For Download...