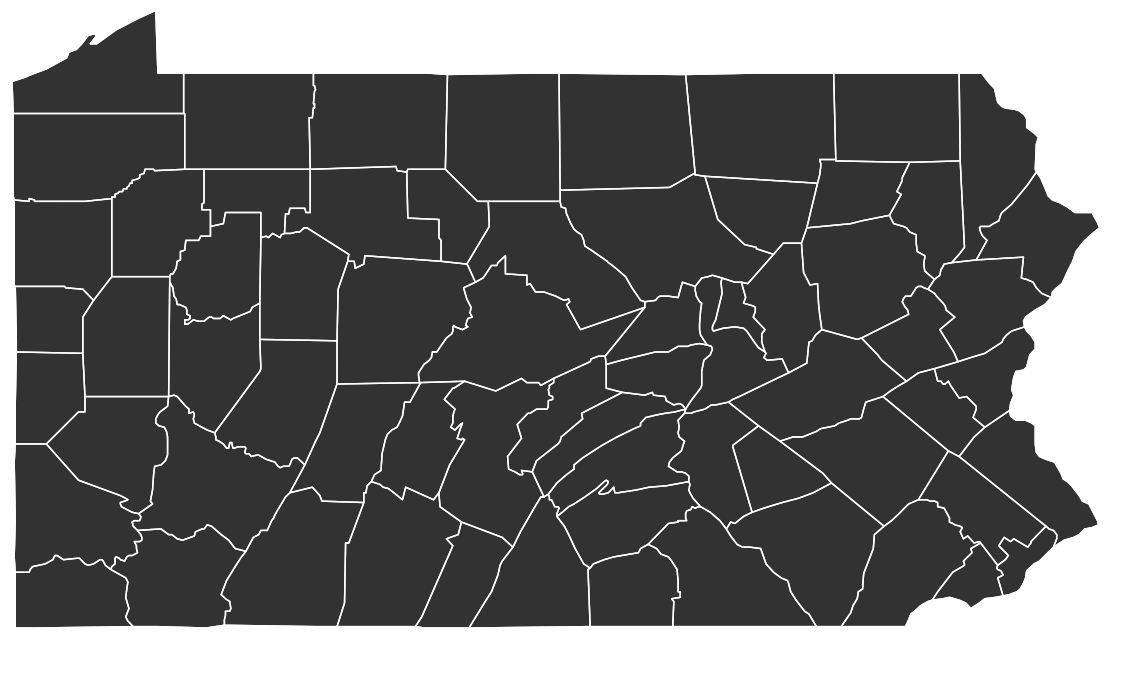
Elements of a sampling design
Enquêtedata analyseren in R

Kelly McConville
Assistant Professor of Statistics
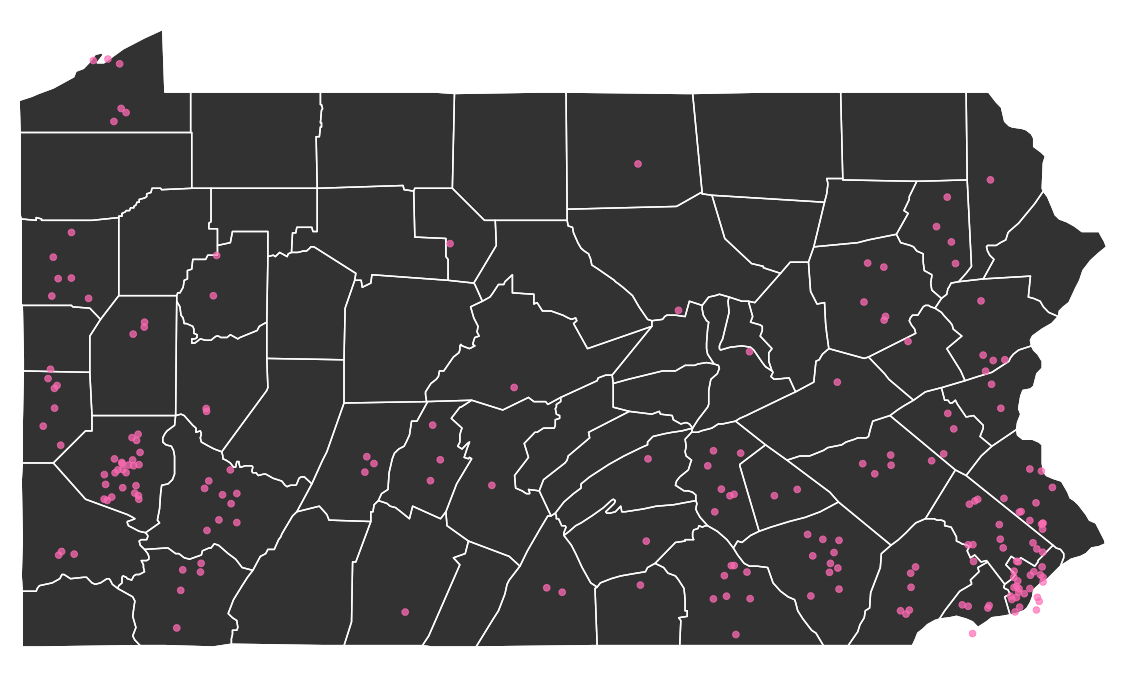
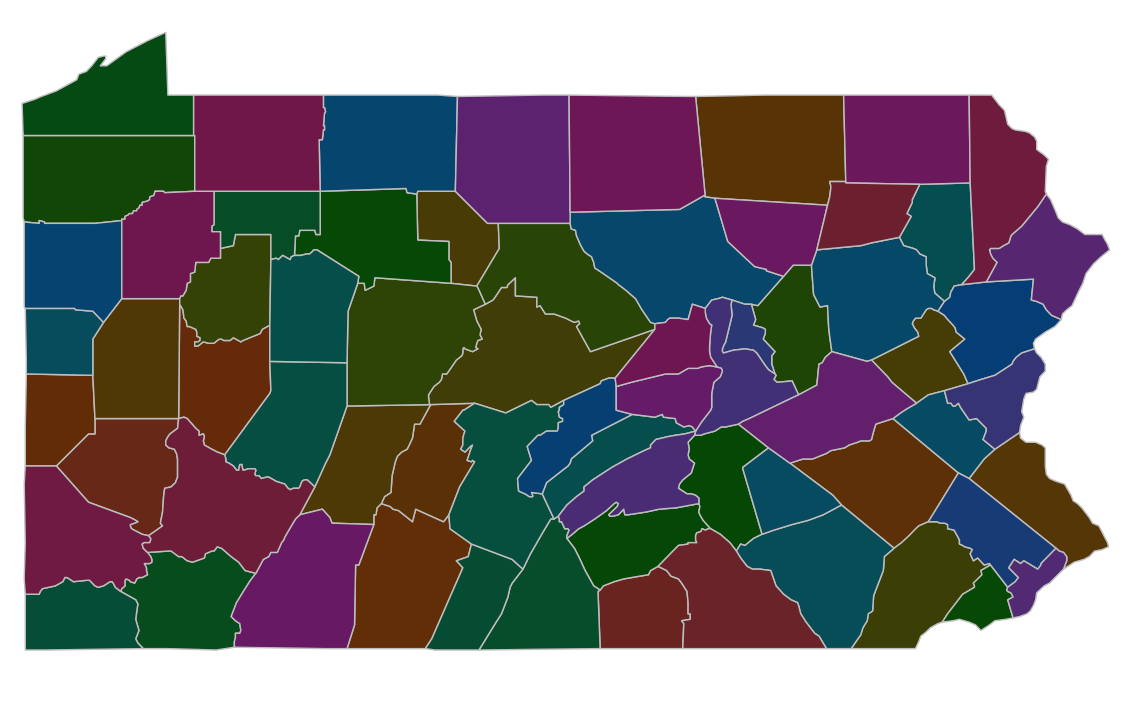
Simple random sampling
Simple random sampling
library(survey)
srs_design <- svydesign(data = paSample,
                        weights = ~wts,
                        fpc = ~N, id = ~1)
Simple random sampling
Simple random sampling
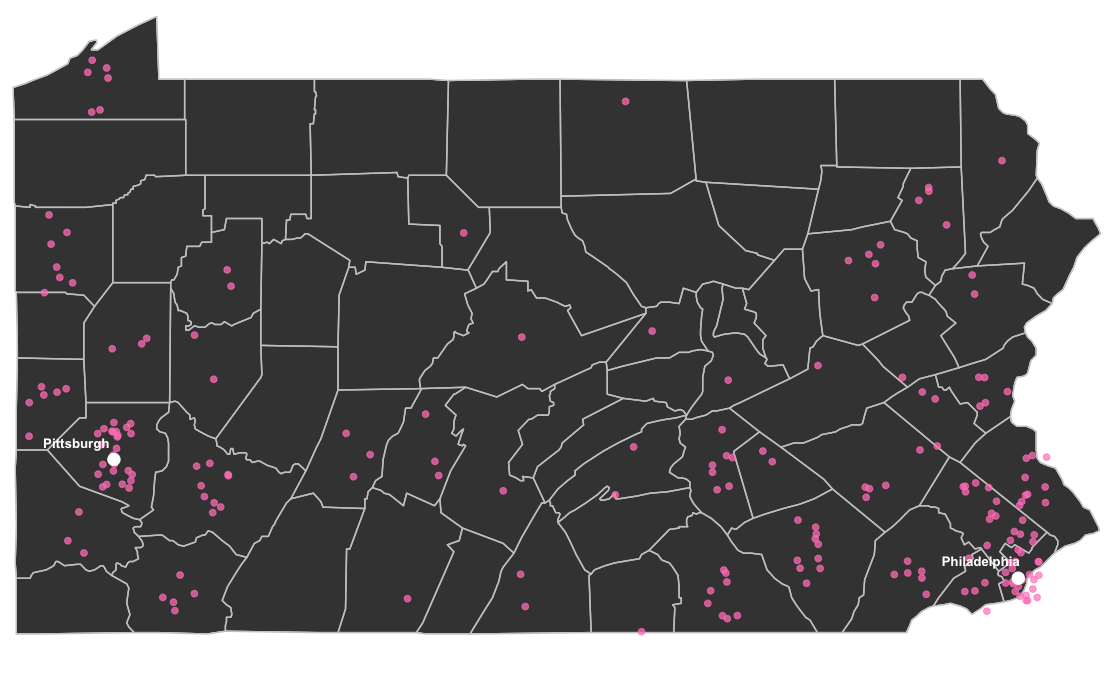
Stratified sampling
Stratified sampling

library(survey)
stratified_design <- svydesign(data = paSample, id = ~1, weights = ~wts,
                               strata = ~county, fpc = ~N)
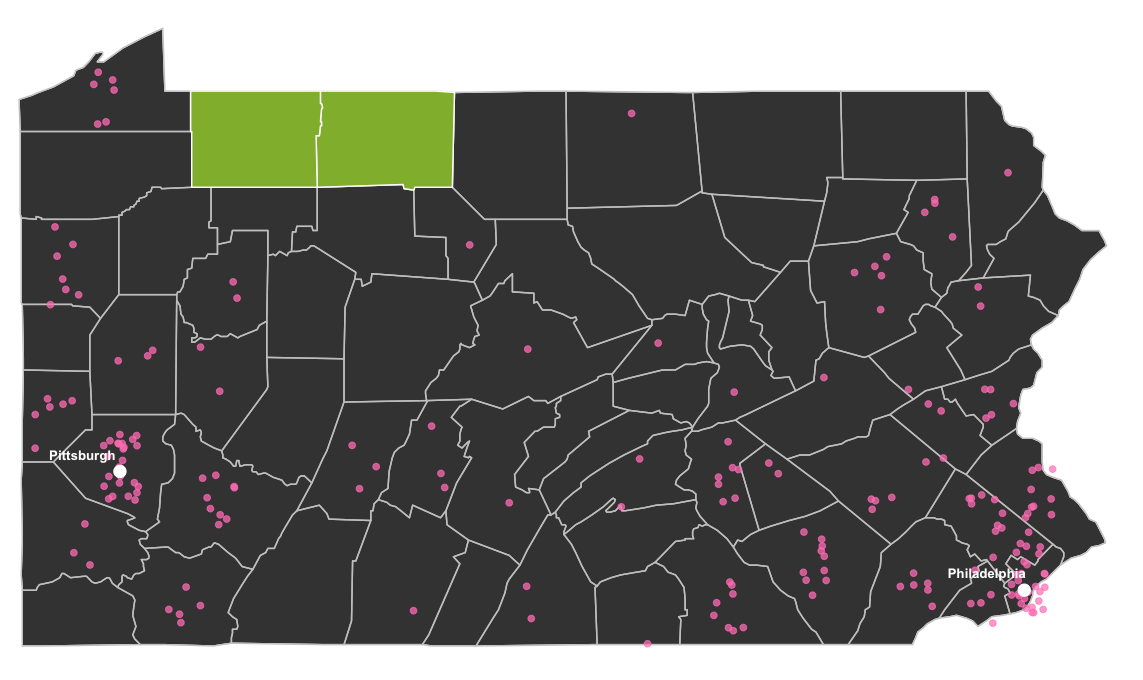
Cluster sampling
Cluster sampling
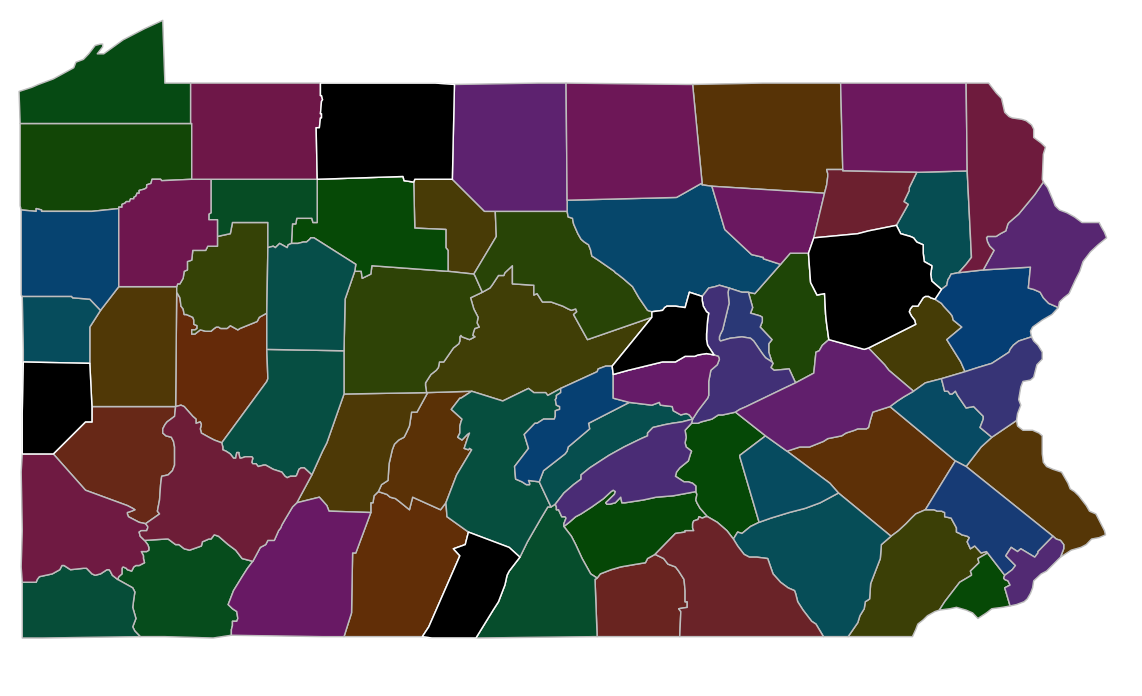
Cluster sampling

library(survey)
cluster_design <- svydesign(data = paSample, id = ~county + personid,
                            fpc = ~N1 + N2, weights = ~wts)

