De (geannualiseerde) Sharpe-ratio
Introductie tot portefeuilleanalyse in R

Kris Boudt
Professor, Free University Brussels & Amsterdam
Prestaties benchmarken
Prestaties benchmarken
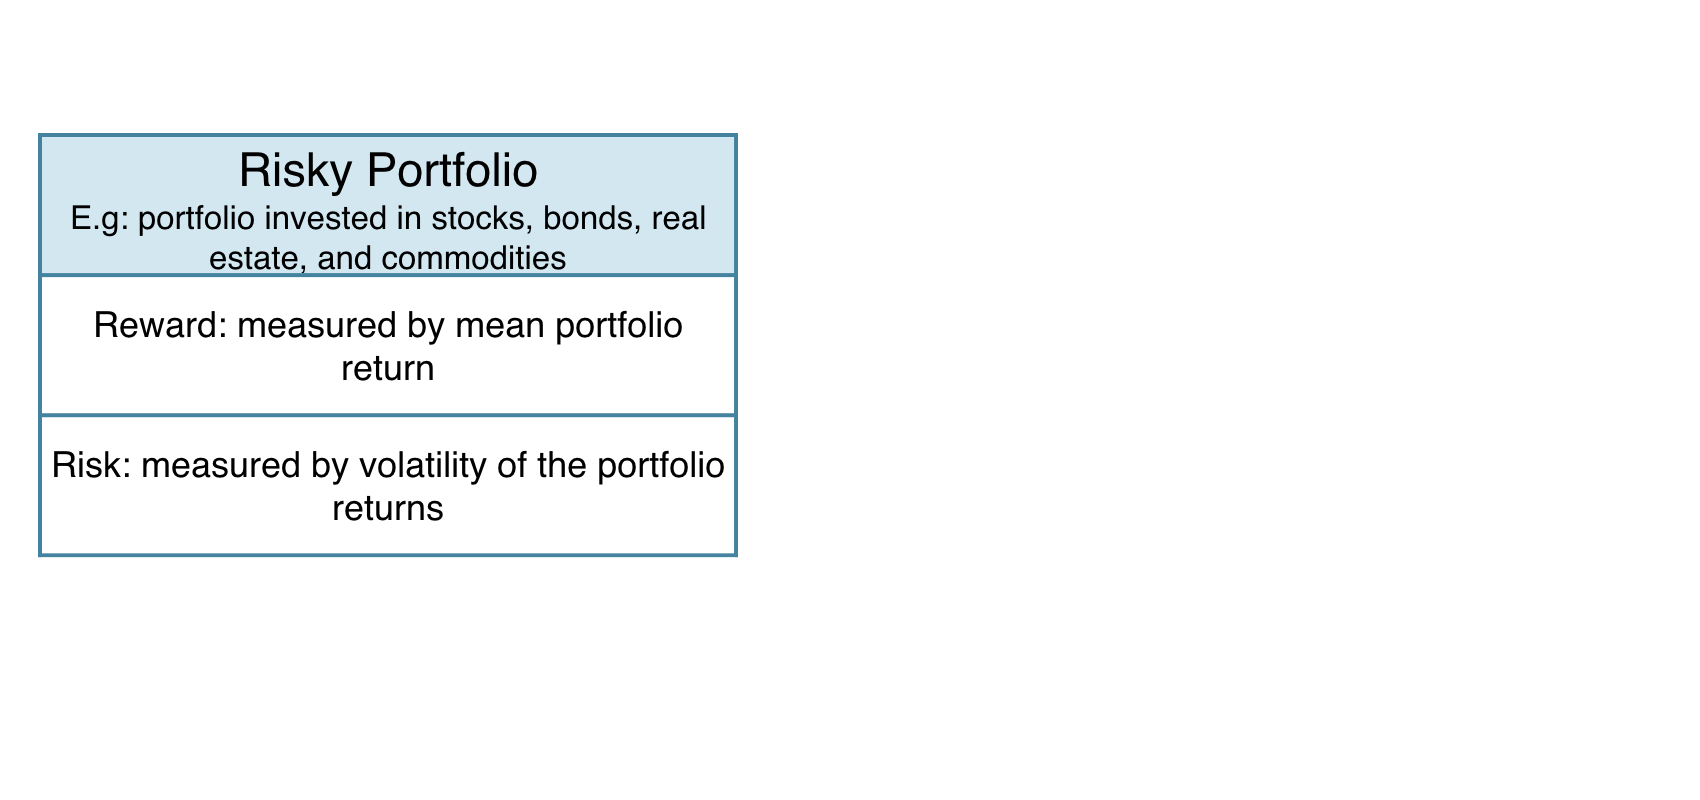
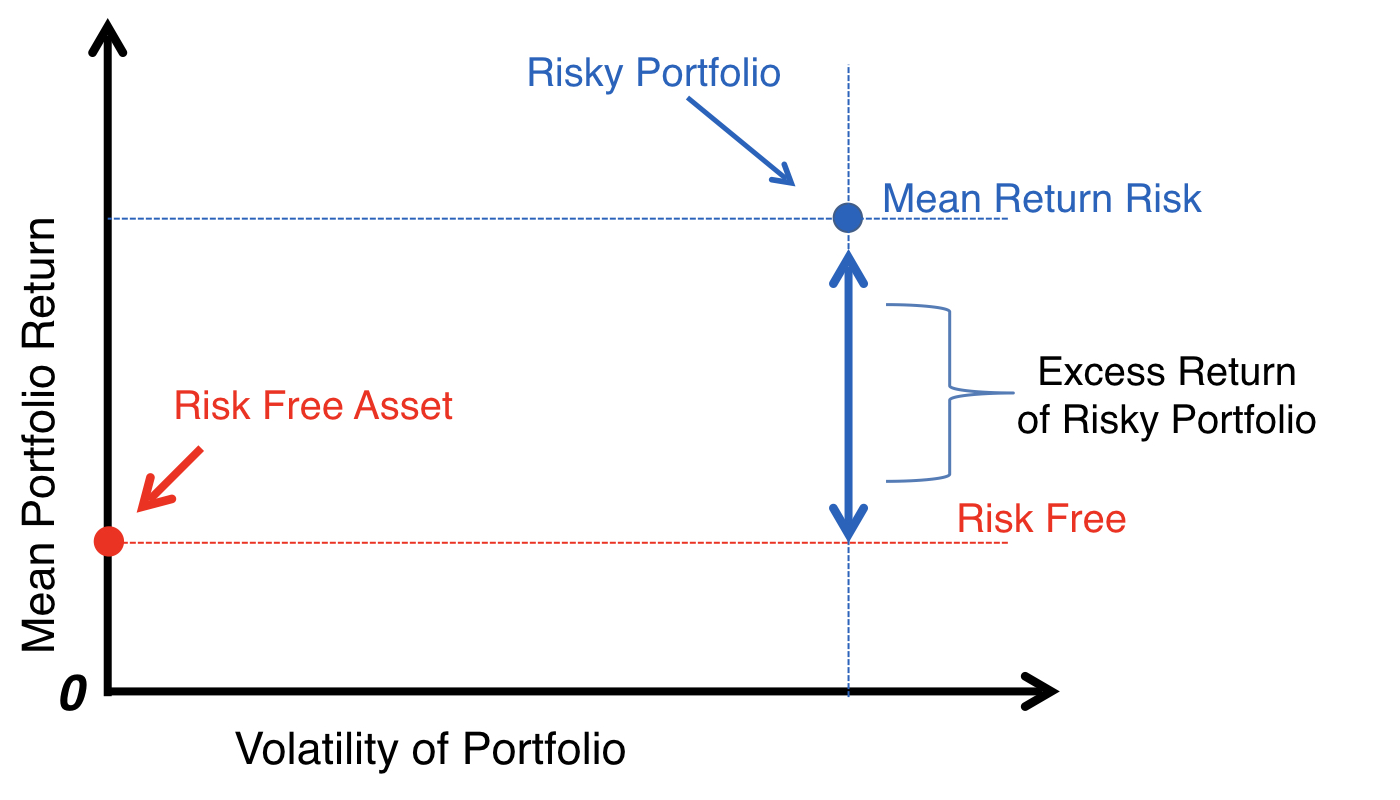
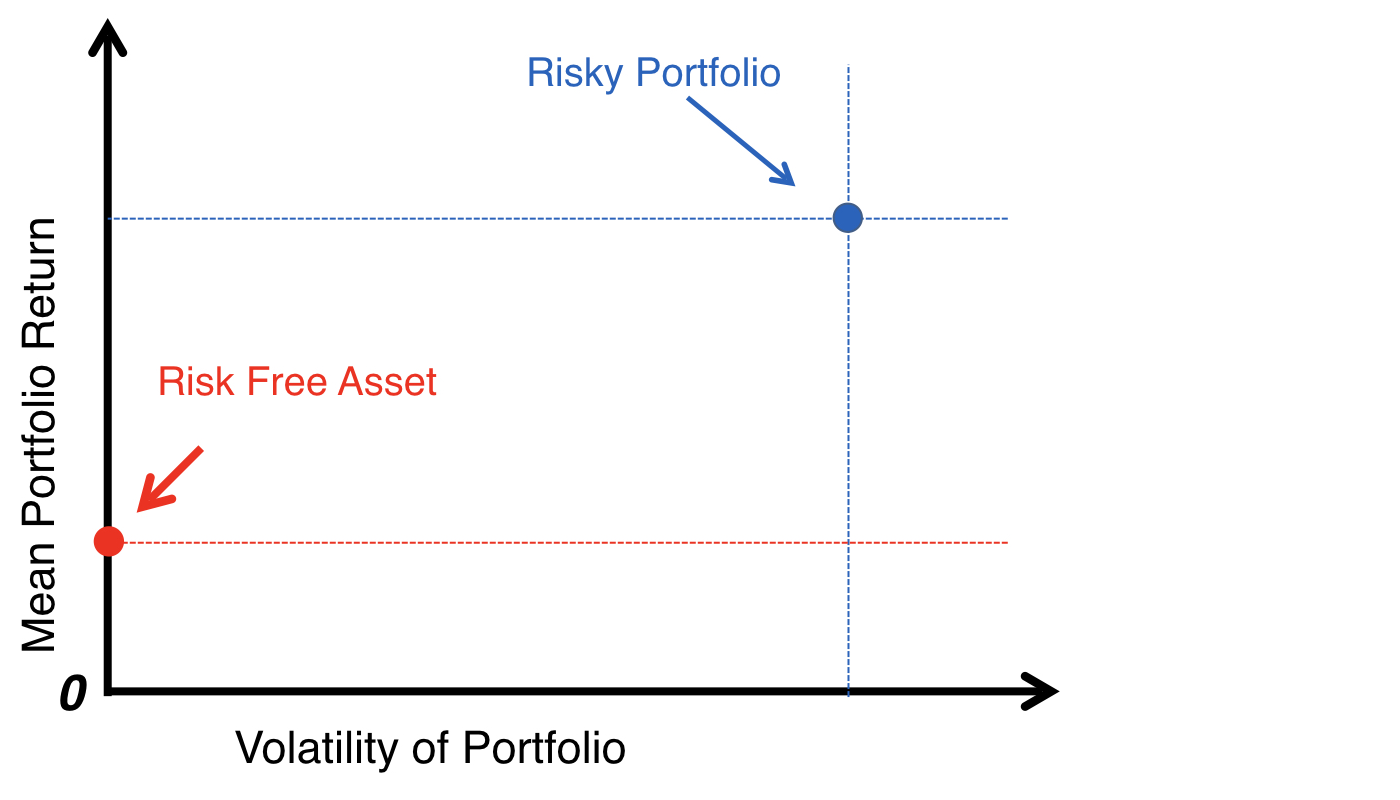
Risico-rendementafweging
Risico-rendementafweging
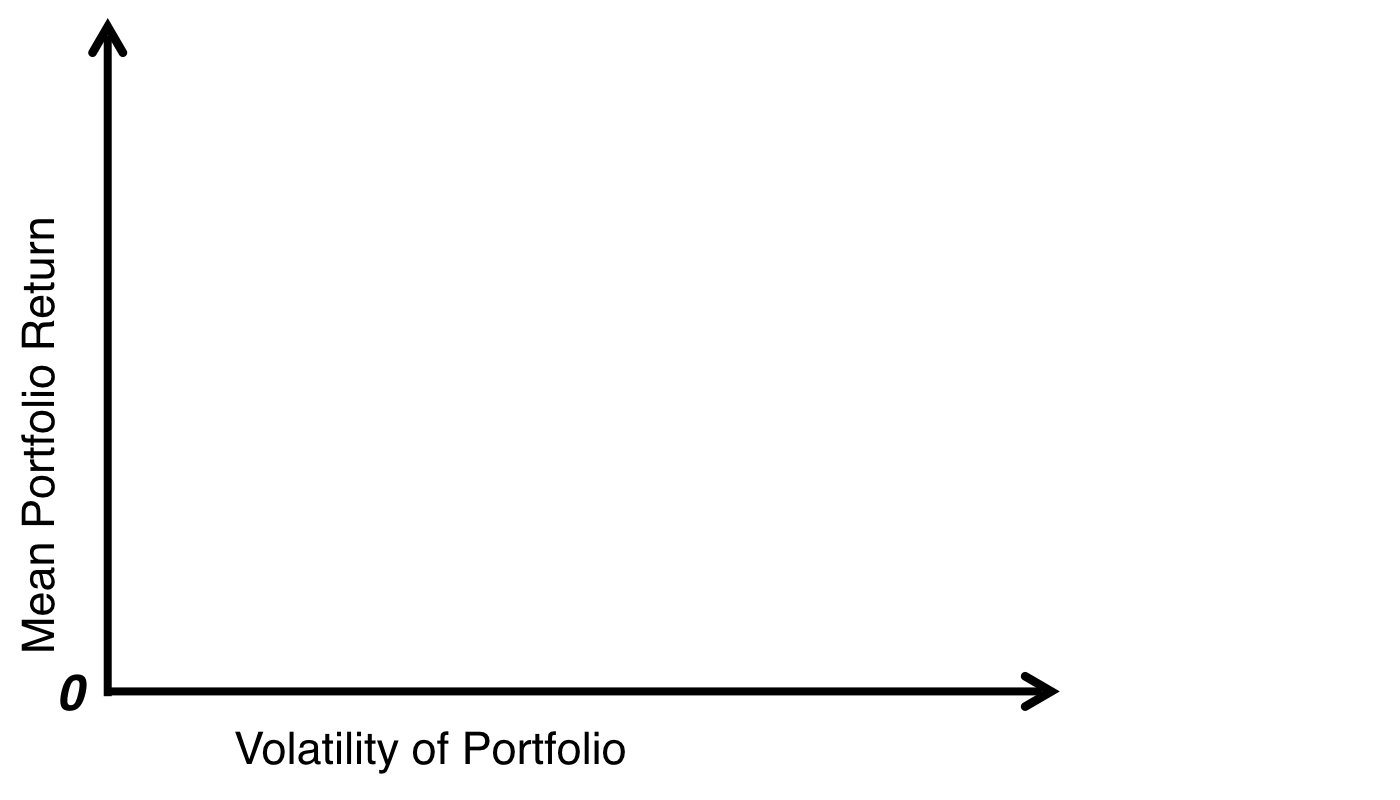
Risico-rendementafweging
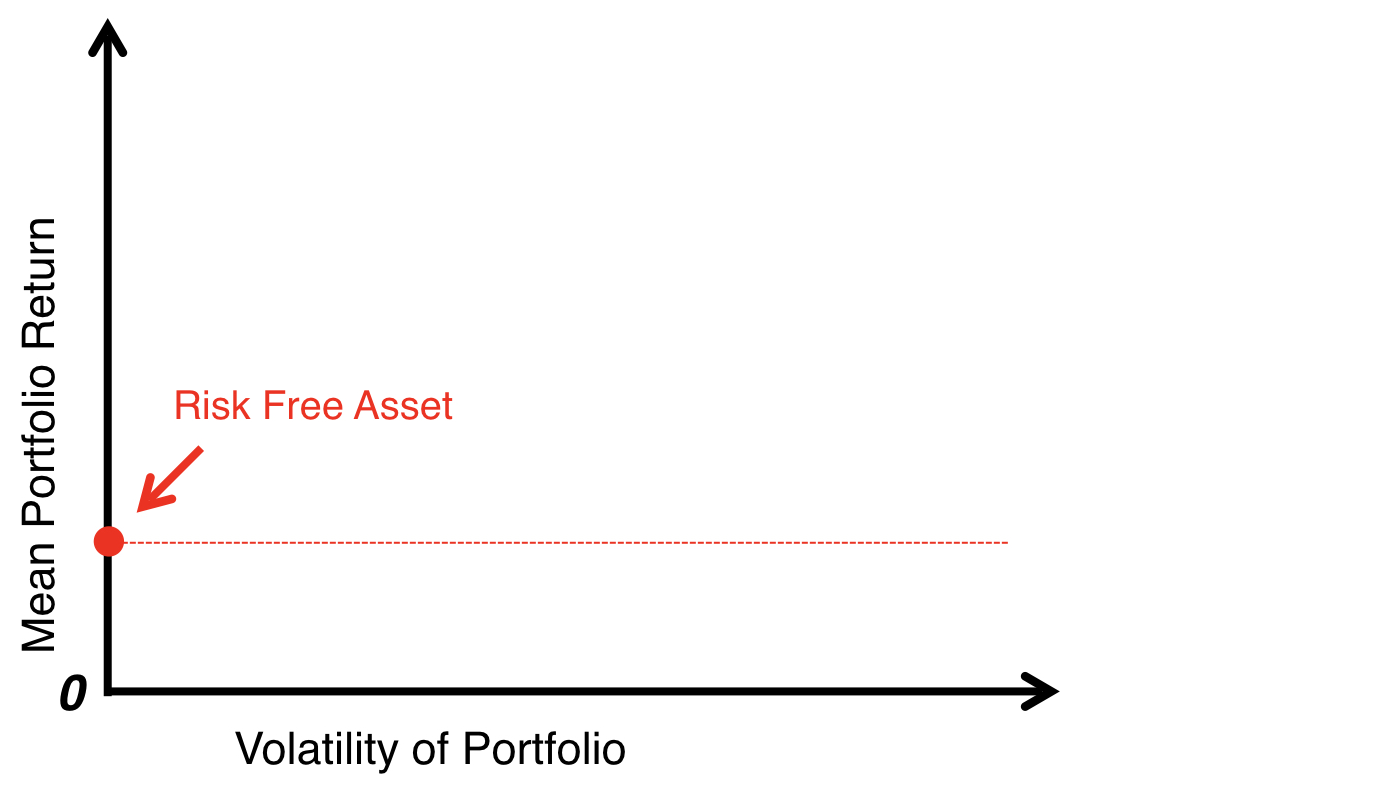
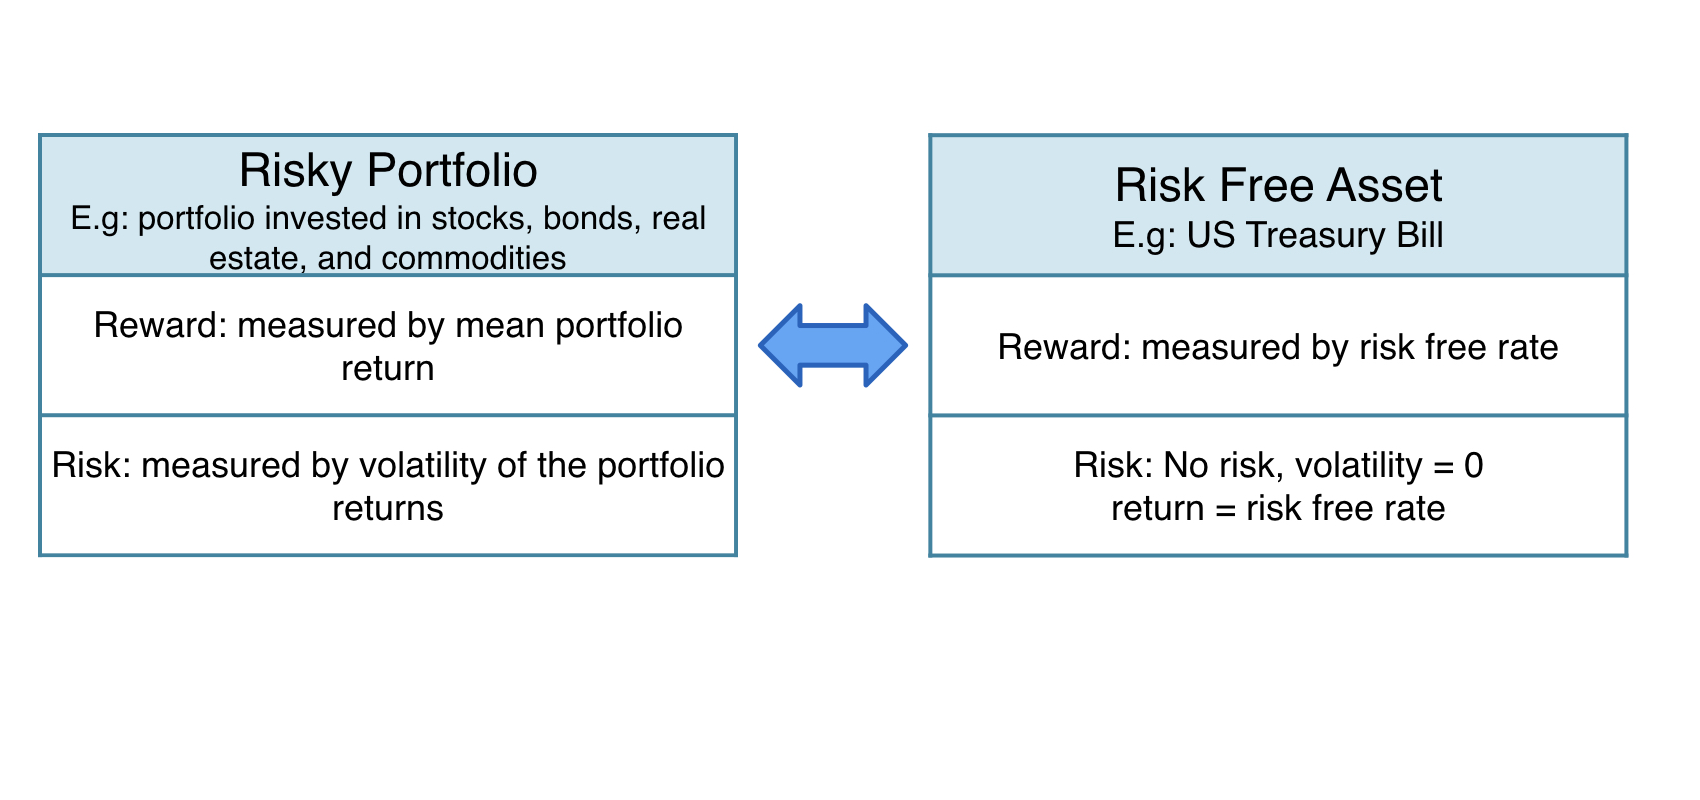
Risico-rendementafweging
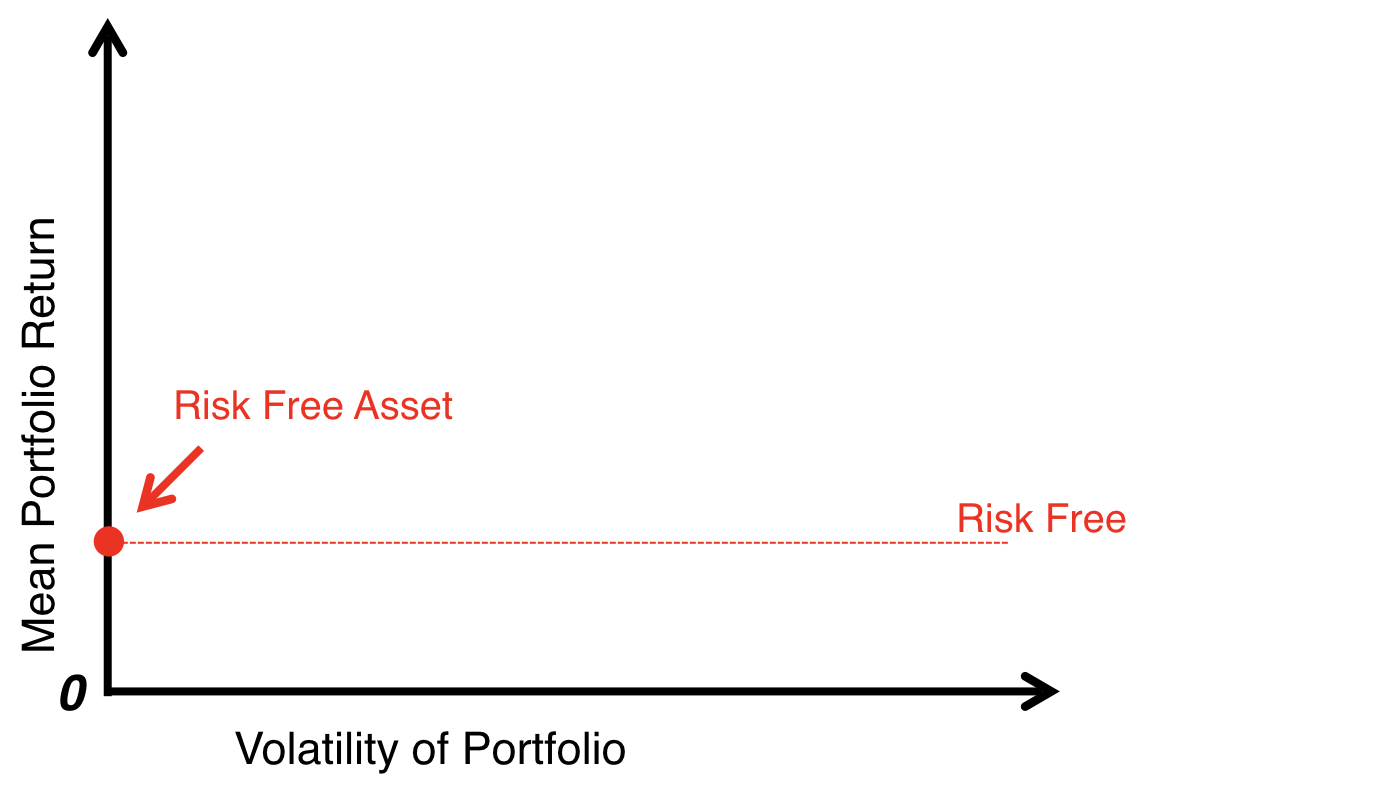
Risico-rendementafweging
Risico-rendementafweging
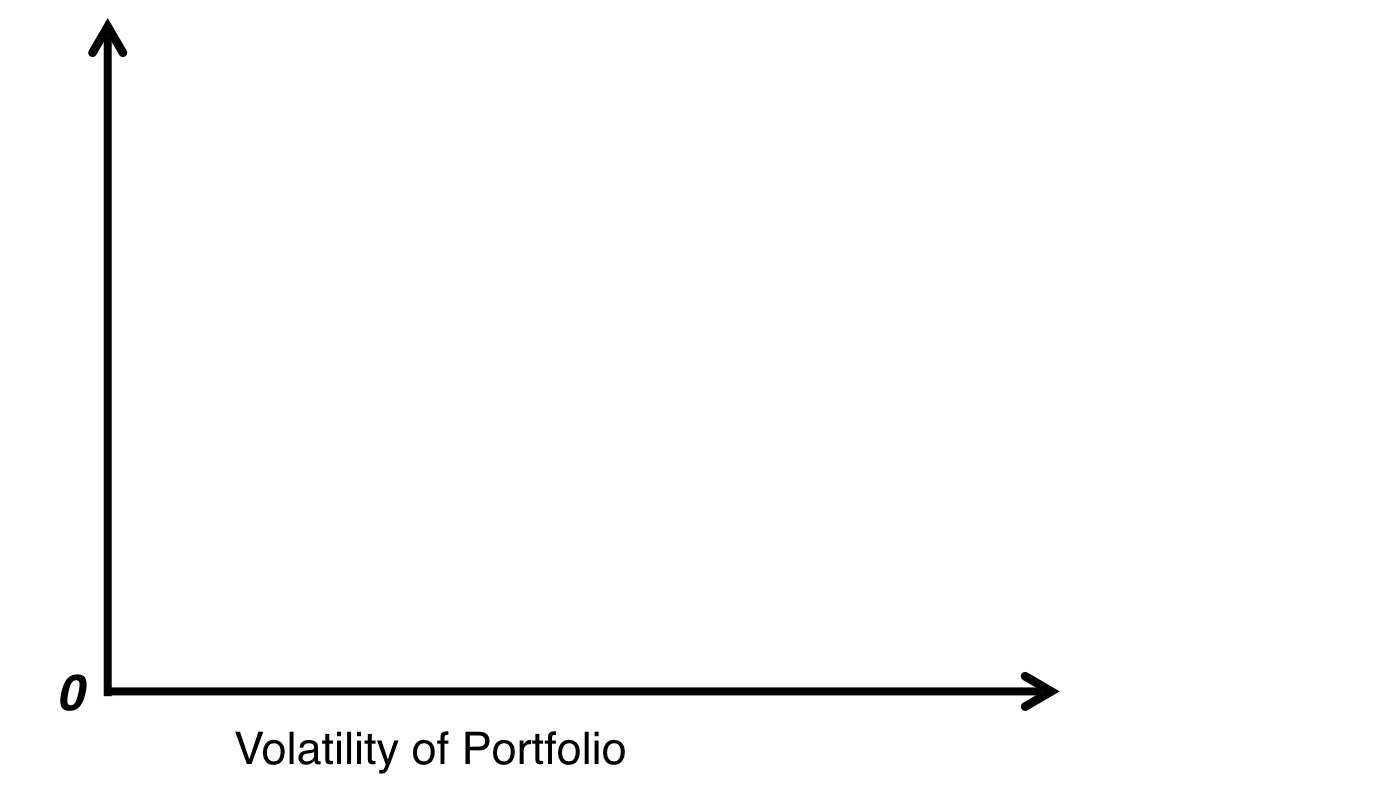
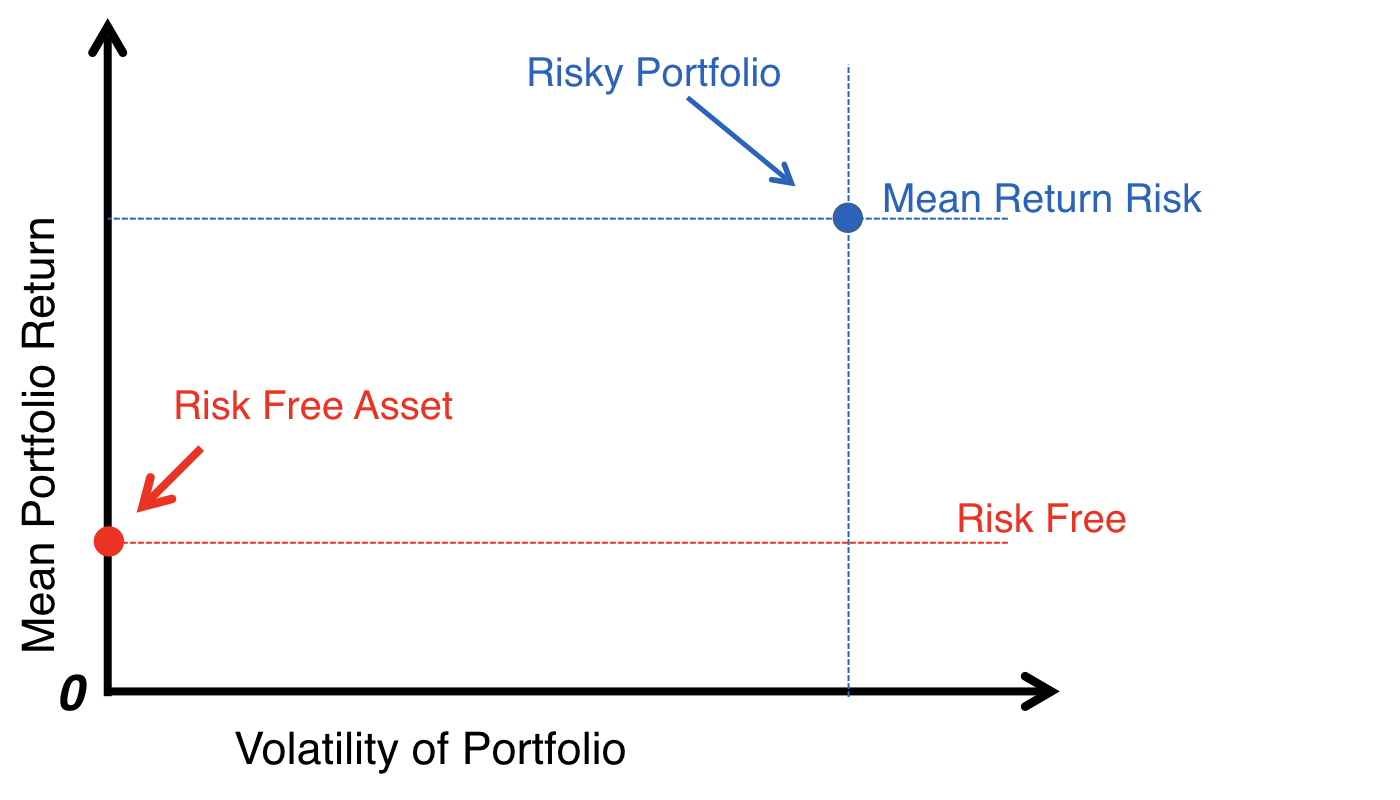
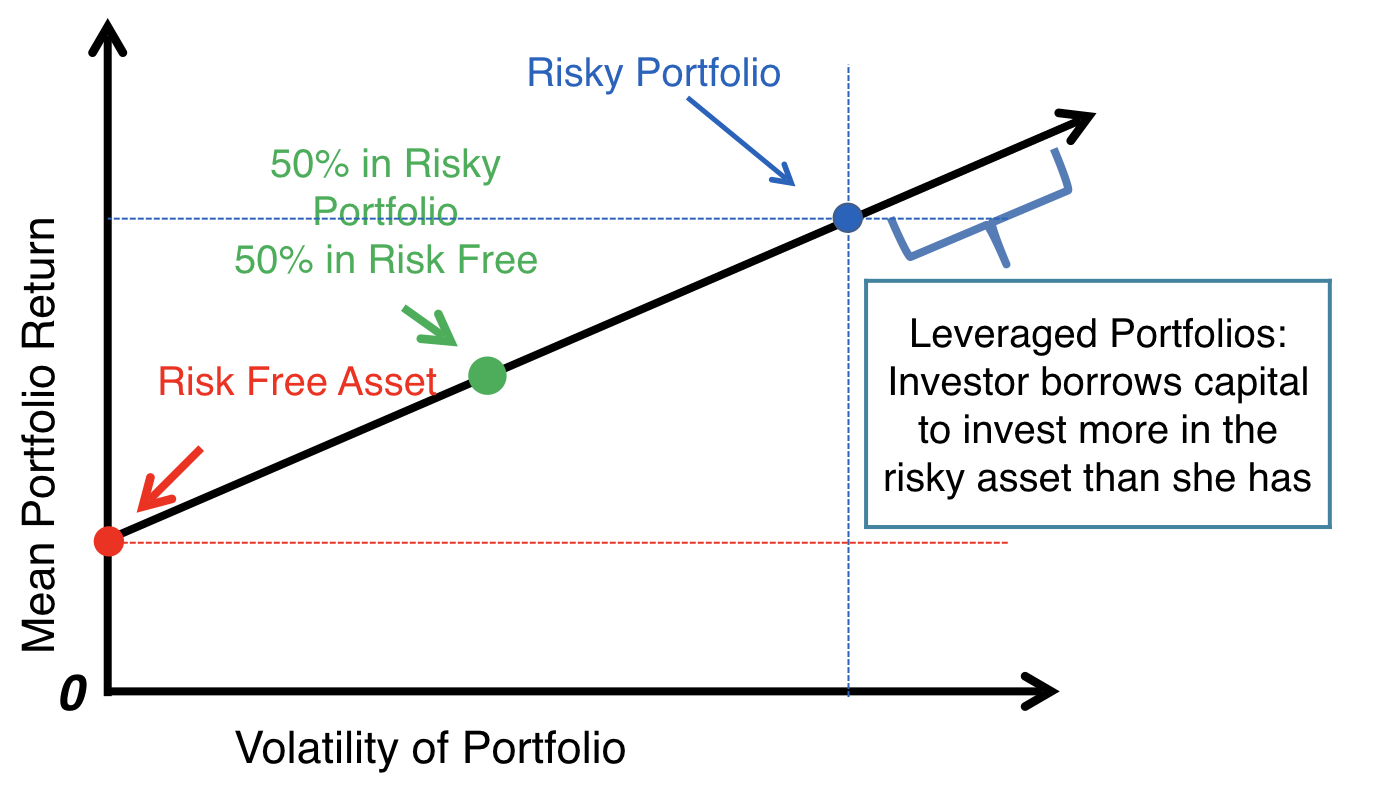
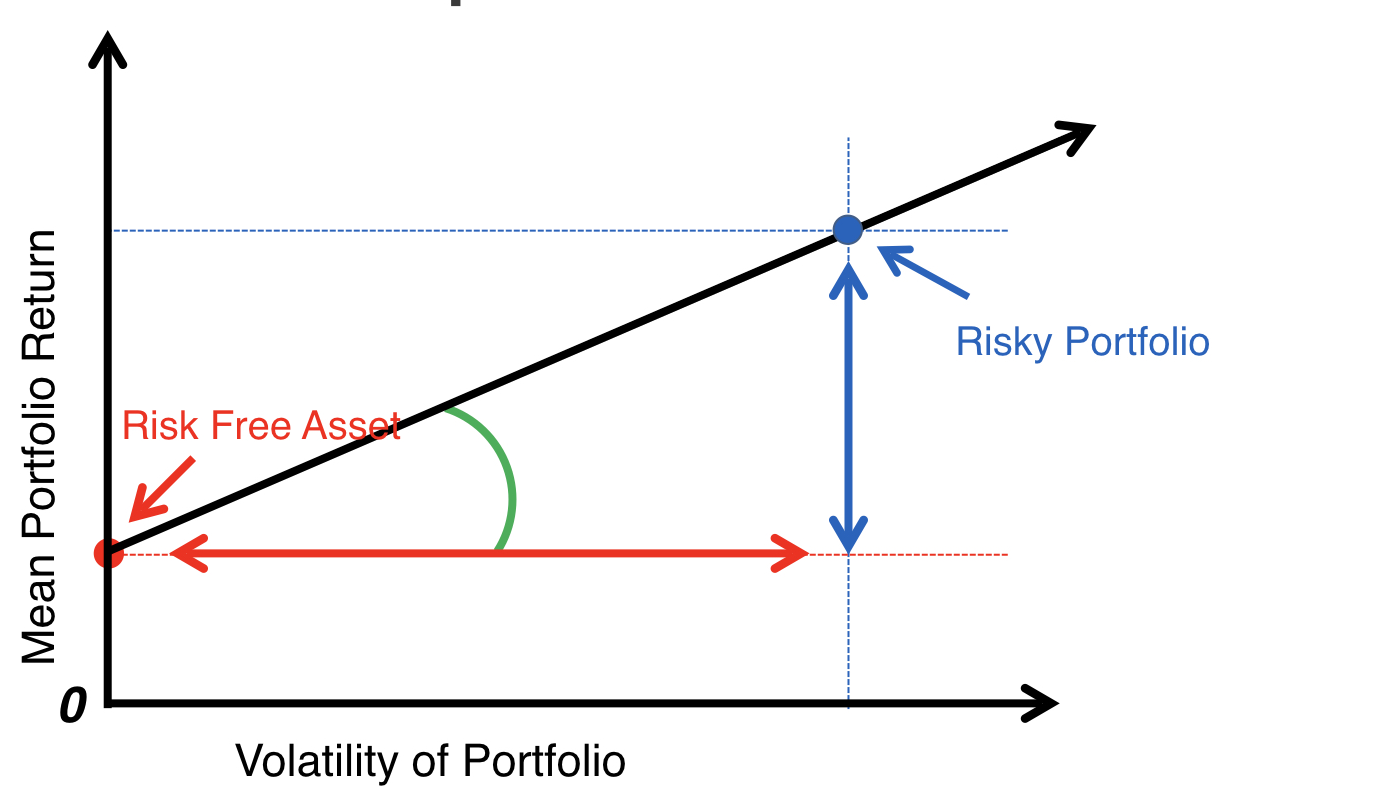
Kapitaalallocatielijn
Kapitaalallocatielijn
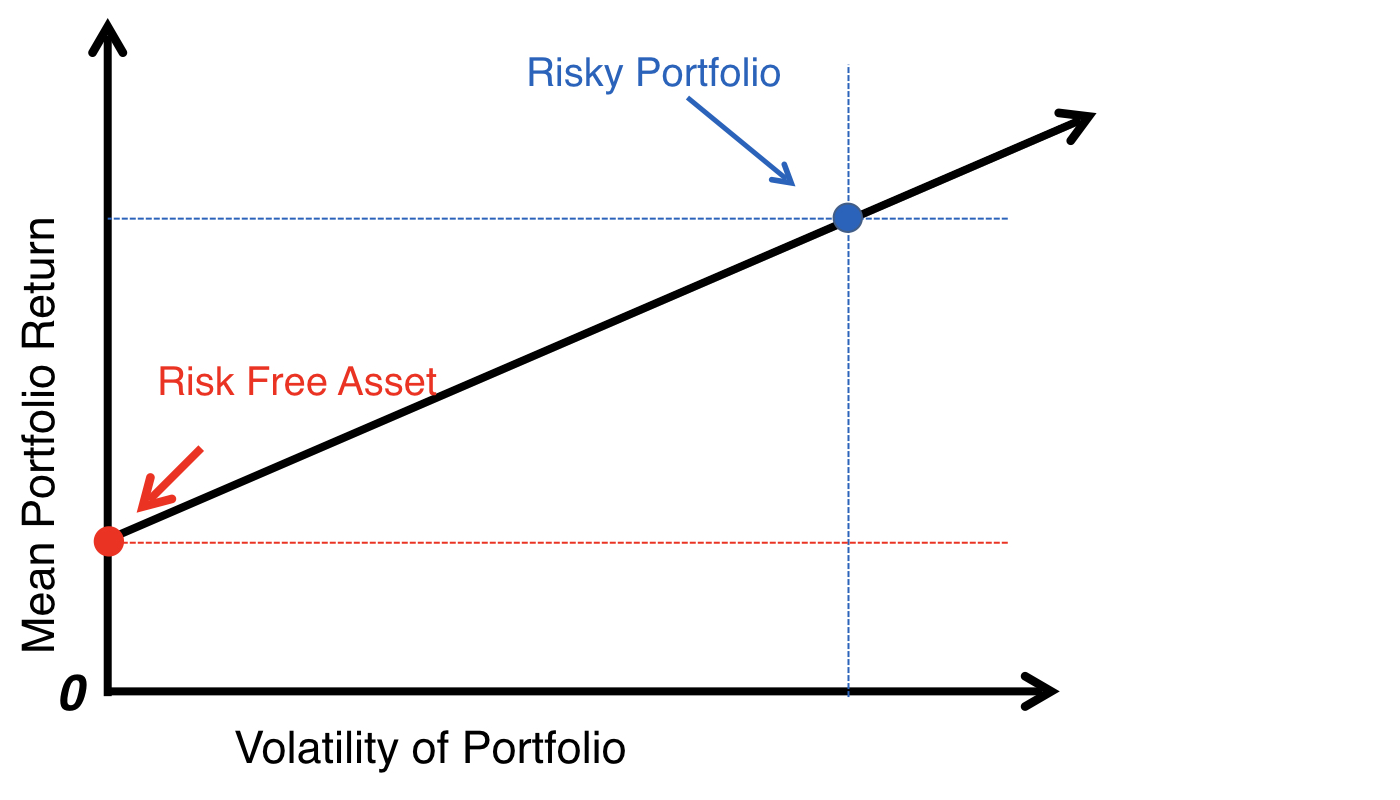
Kapitaalallocatielijn
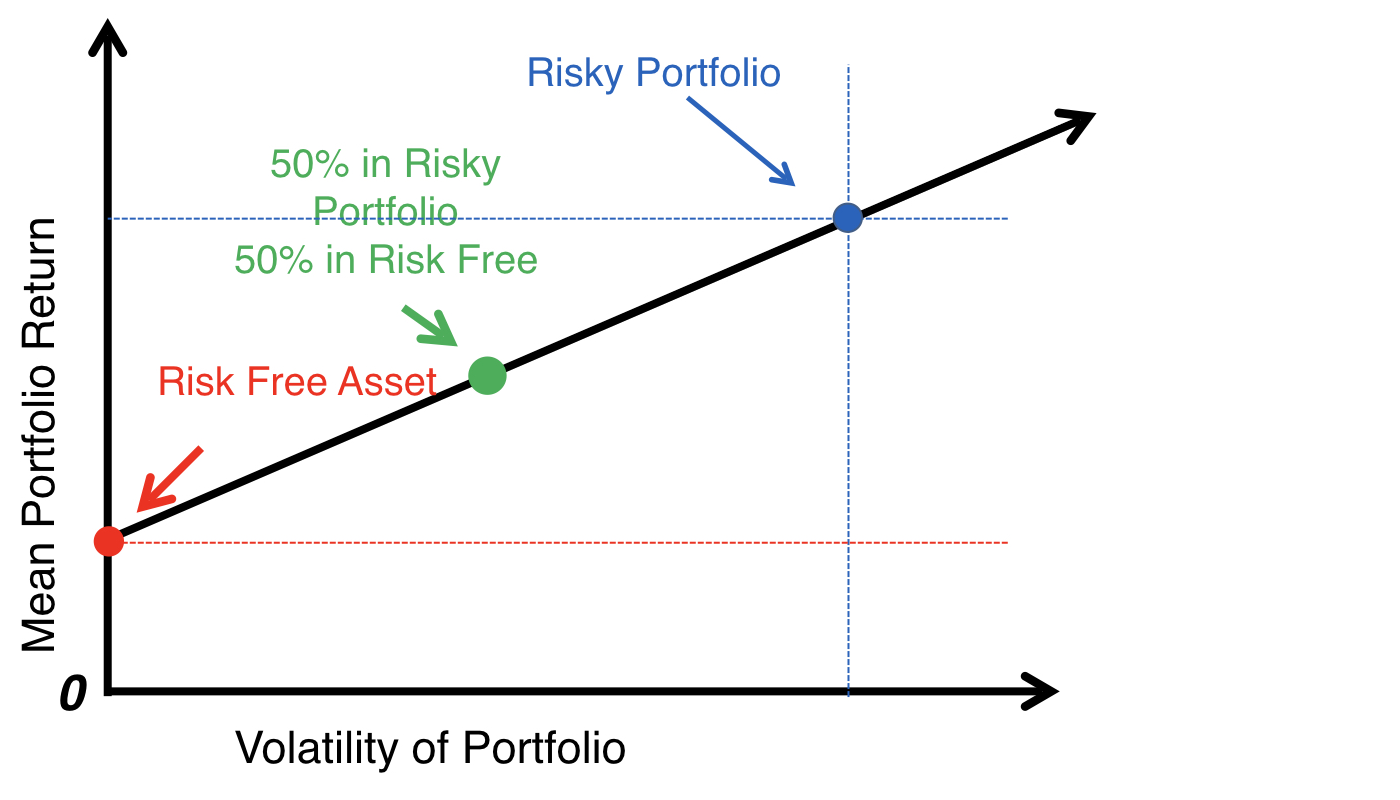
Kapitaalallocatielijn
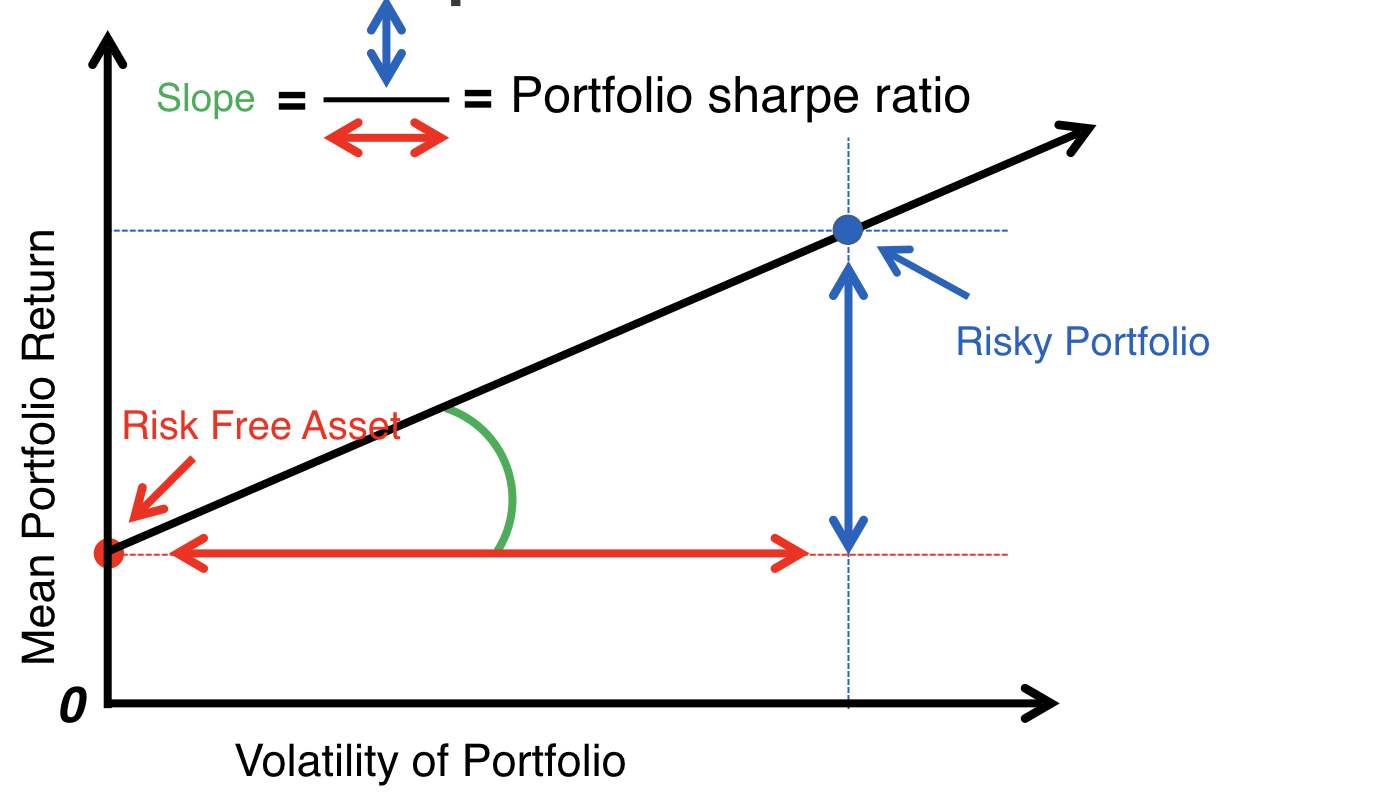
De Sharpe-ratio
De Sharpe-ratio
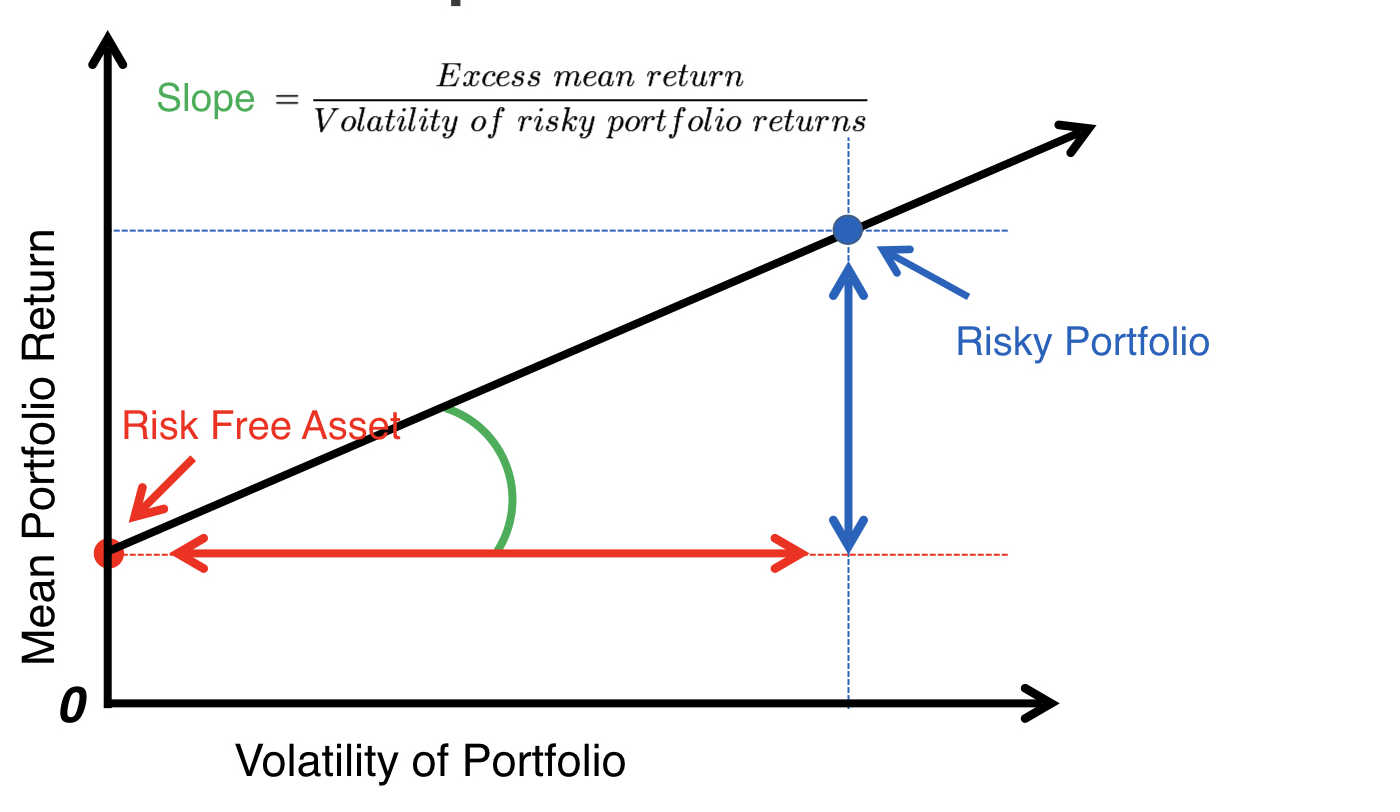
De Sharpe-ratio

De Sharpe-ratio
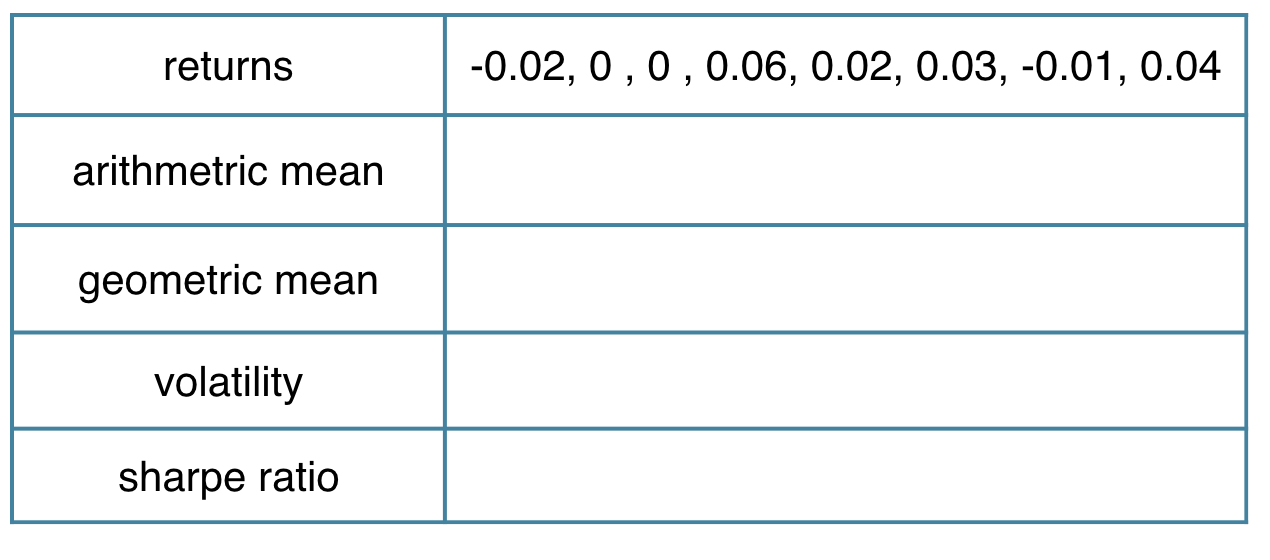
Prestatiestatistieken in actie
library(PerformanceAnalytics)
sample_returns <- c(-0.02, 0.00, 0.00, 0.06, 0.02, 0.03, -0.01, 0.04)
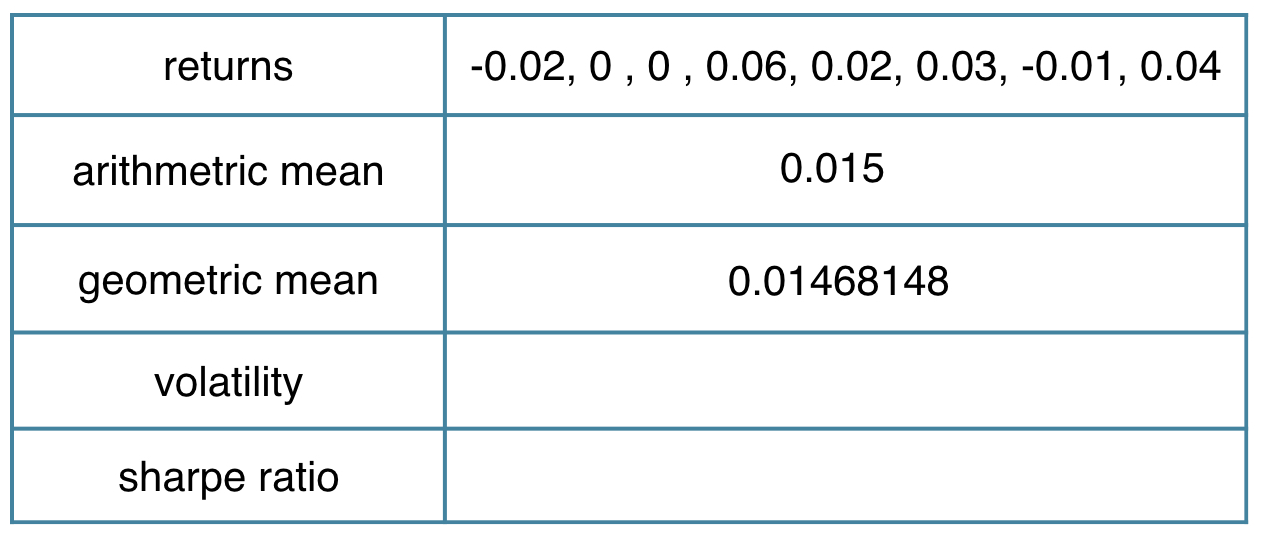
Prestatiestatistieken in actie
library(PerformanceAnalytics)
sample_returns <- c(-0.02, 0.00, 0.00, 0.06, 0.02, 0.03, -0.01, 0.04)
mean(sample_returns)

Prestatiestatistieken in actie
library(PerformanceAnalytics)
sample_returns <- c(-0.02, 0.00, 0.00, 0.06, 0.02, 0.03, -0.01, 0.04)
mean.geometric(sample_returns)
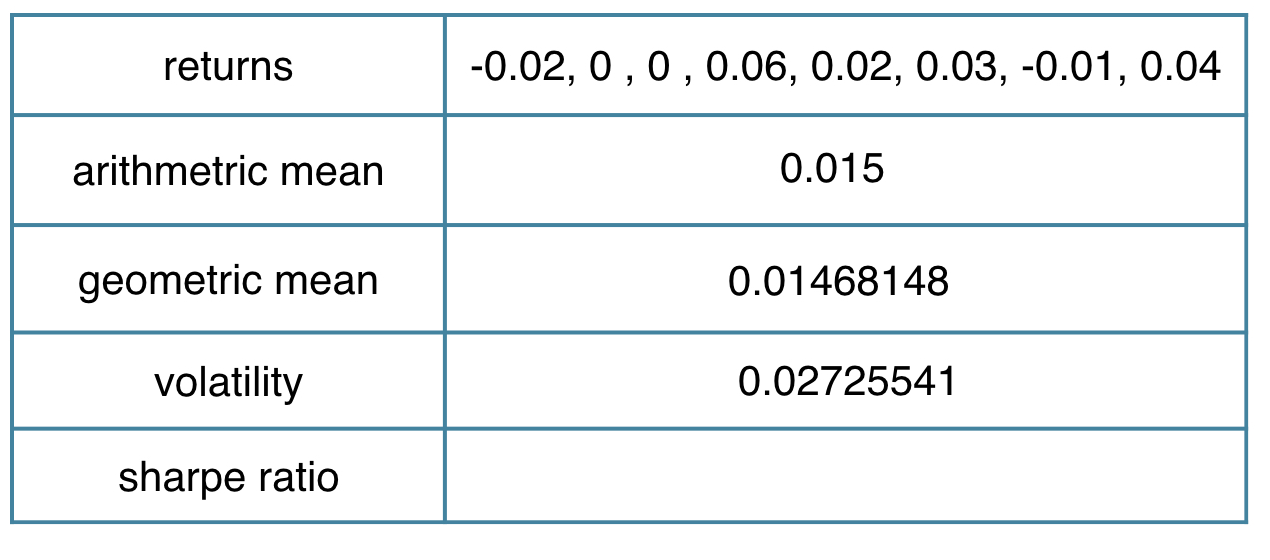
Prestatiestatistieken in actie
library(PerformanceAnalytics)
sample_returns <- c(-0.02, 0.00, 0.00, 0.06, 0.02, 0.03, -0.01, 0.04)
StdDev(sample_returns)
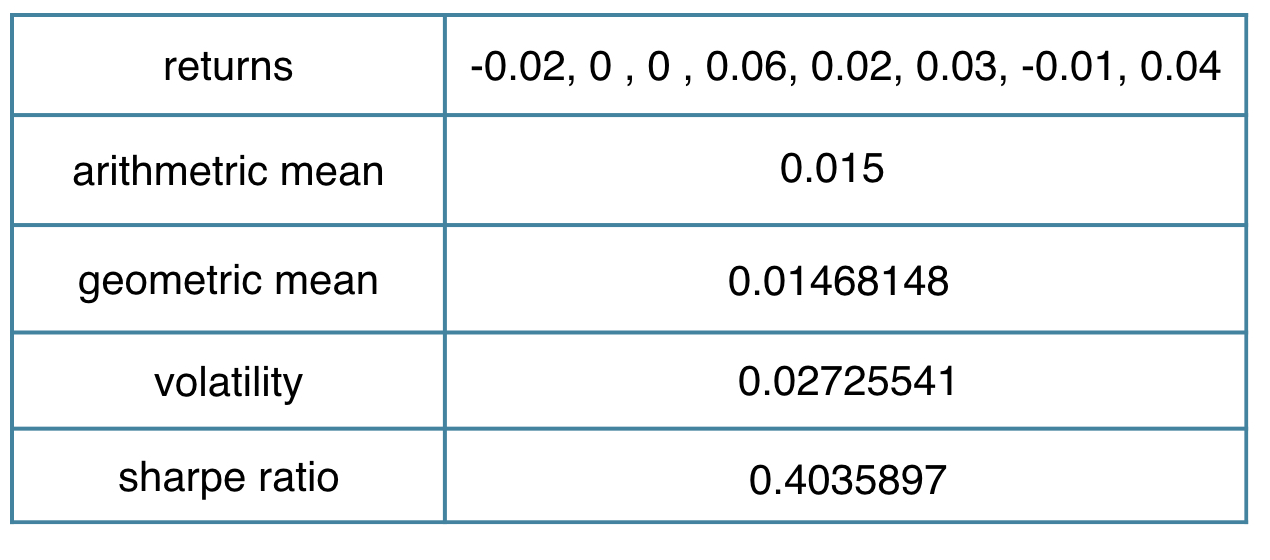
Prestatiestatistieken in actie
library(PerformanceAnalytics)
sample_returns <- c(-0.02, 0.00, 0.00, 0.06, 0.02, 0.03, -0.01, 0.04)
(mean(sample_returns)-0.004)/StdDev(sample_returns)
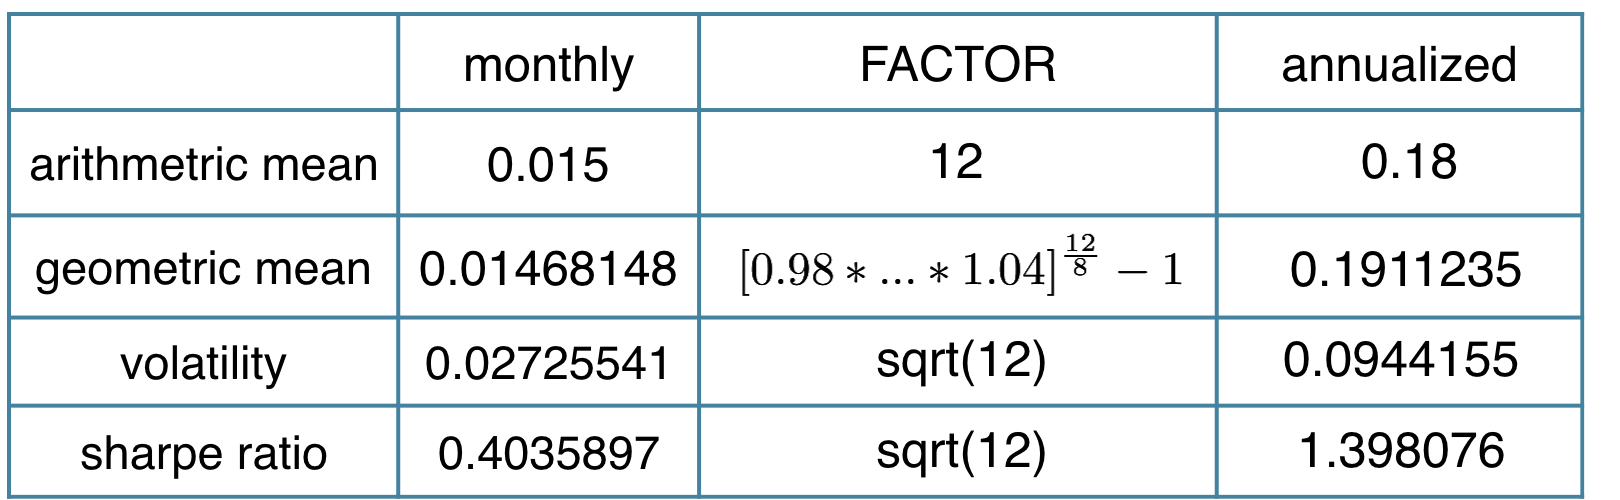
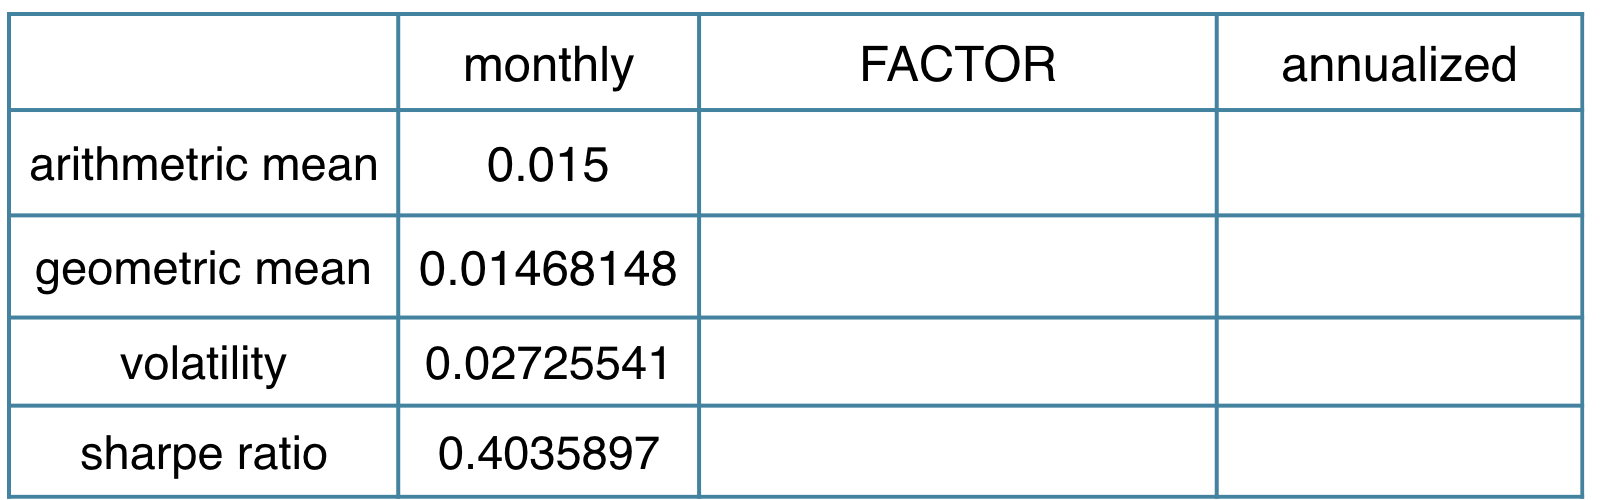
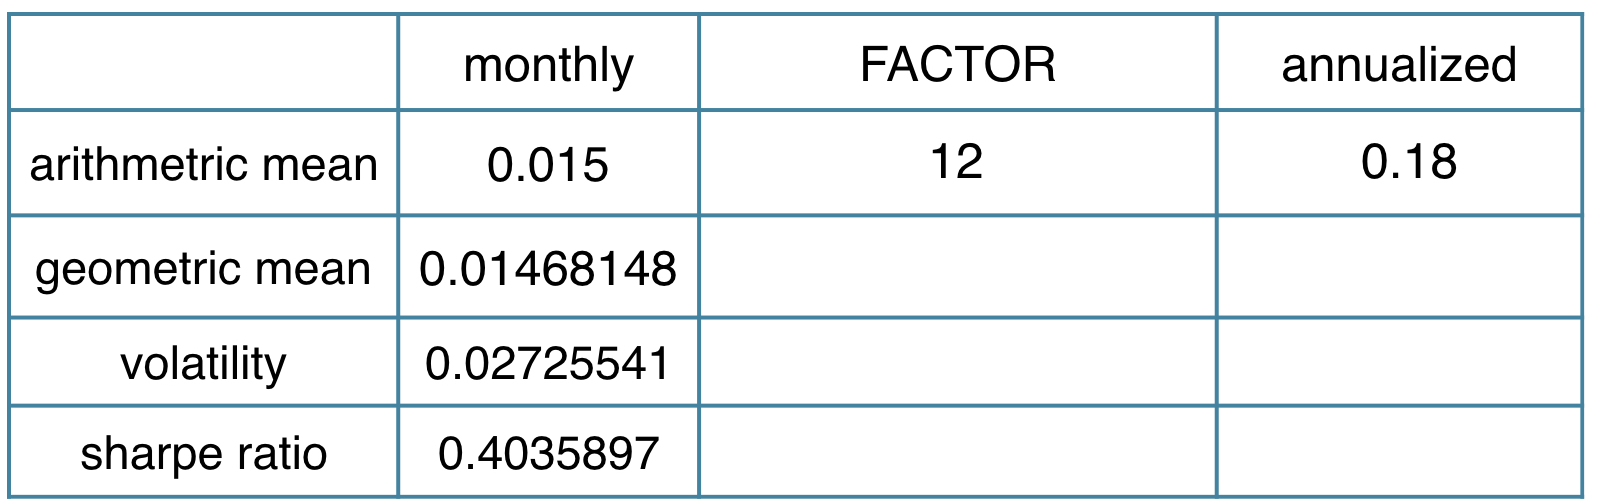
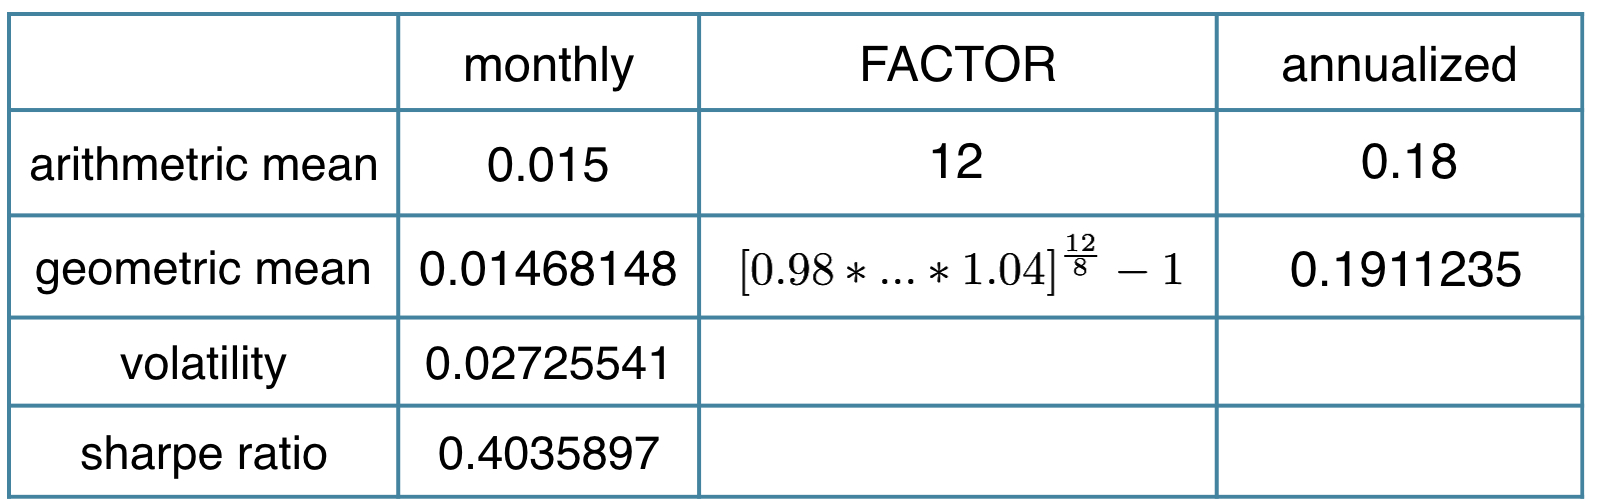
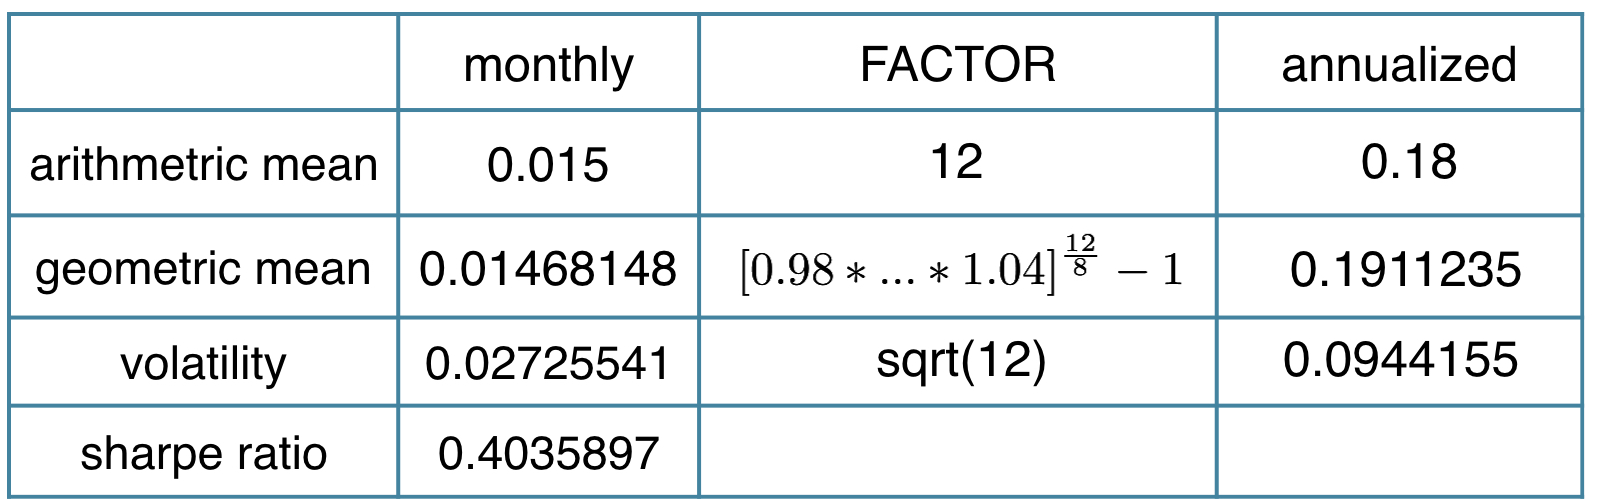
Maandprestaties annualiseren
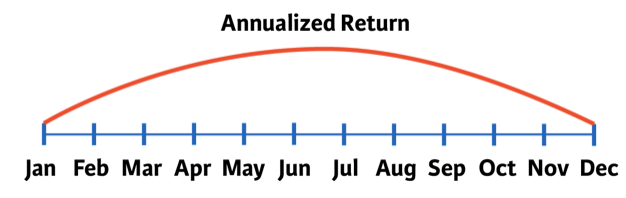
- Rekenkundig gemiddelde: maandgemiddelde * 12
- Meetkundig gemiddelde, als $R_i$ maandrendementen zijn:
- $[(1+R_1)\cdot(1+R_2)\cdot...\cdot(1+R_T)]^{12/T} -1$
- Volatiliteit: maandvolatiliteit * sqrt(12)
Prestatiestatistieken in actie
library(PerformanceAnalytics)
sample_returns <- c( -0.02, 0.00, 0.00, 0.06, 0.02, 0.03, -0.01, 0.04)
Prestatiestatistieken in actie
library(PerformanceAnalytics)
sample_returns <- c( -0.02, 0.00, 0.00, 0.06, 0.02, 0.03, -0.01, 0.04)
Return.annualized(sample_returns, scale = 12, geometric = FALSE)
Prestatiestatistieken in actie
library(PerformanceAnalytics)
sample_returns <- c( -0.02, 0.00, 0.00, 0.06, 0.02, 0.03, -0.01, 0.04)
Return.annualized(sample_returns, scale = 12, geometric = TRUE)
Prestatiestatistieken in actie
library(PerformanceAnalytics)
sample_returns <- c( -0.02, 0.00, 0.00, 0.06, 0.02, 0.03, -0.01, 0.04)
Std.Dev.annualized(sample_returns, scale = 12)
Prestatiestatistieken in actie
library(PerformanceAnalytics)
sample_returns <- c( -0.02, 0.00, 0.00, 0.06, 0.02, 0.03, -0.01, 0.04)
Return.annualized(sample_returns, scale = 12)/
    Std.Dev.annualized(sample_returns, scale = 12)