Marketinganalyse: klantverloop voorspellen in Python
Mark Peterson
Director of Data Science, Infoblox
Met de bibliotheek seaborn maak je snel informatieve en aantrekkelijke plots
Gebouwd op matplotlib
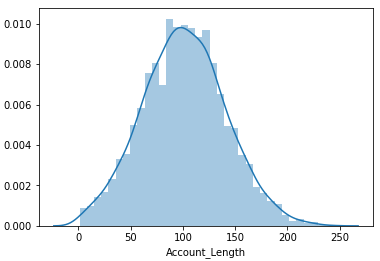
import matplotlib.pyplot as plt import seaborn as snssns.distplot(telco['Account_Length'])plt.show()

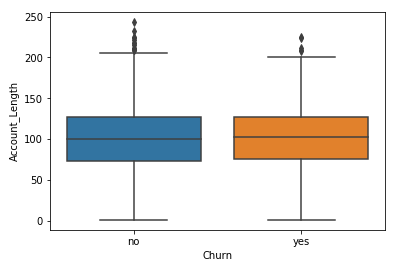
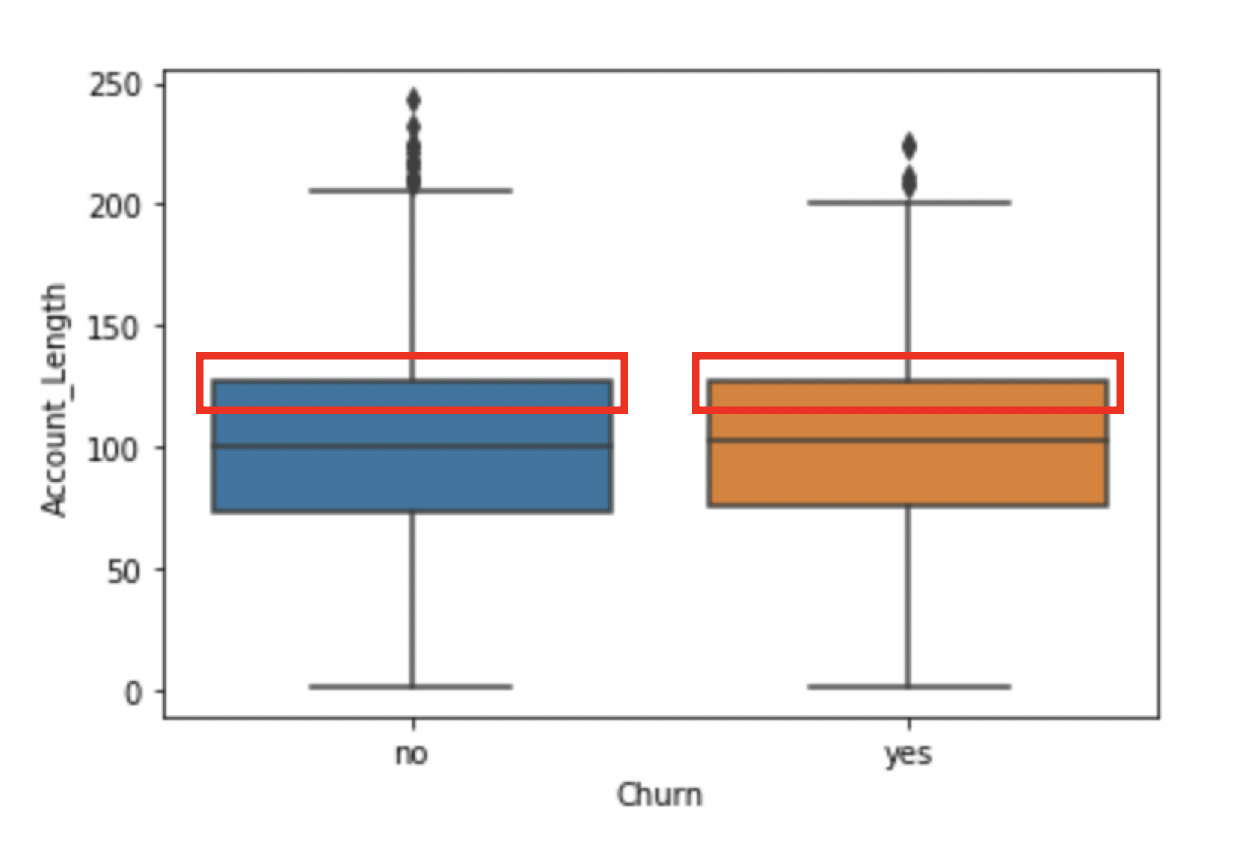
sns.boxplot(x = 'Churn',
y = 'Account_Length',
data = telco)
plt.show()

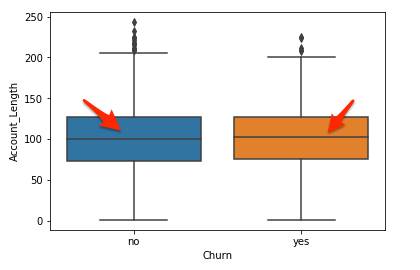
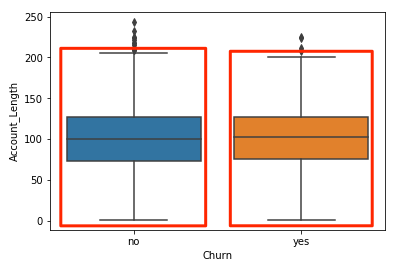
sns.boxplot(x = 'Churn',
y = 'Account_Length',
data = telco)
plt.show()

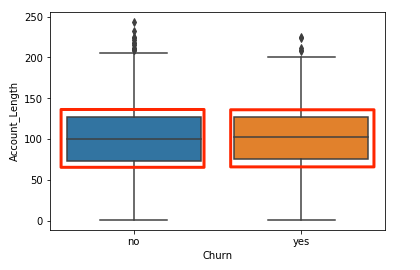
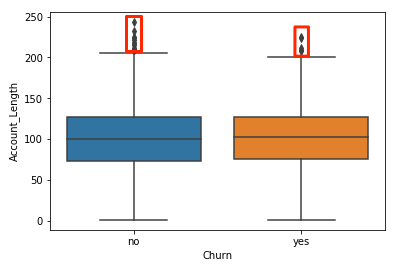
sns.boxplot(x = 'Churn',
y = 'Account_Length',
data = telco)
plt.show()

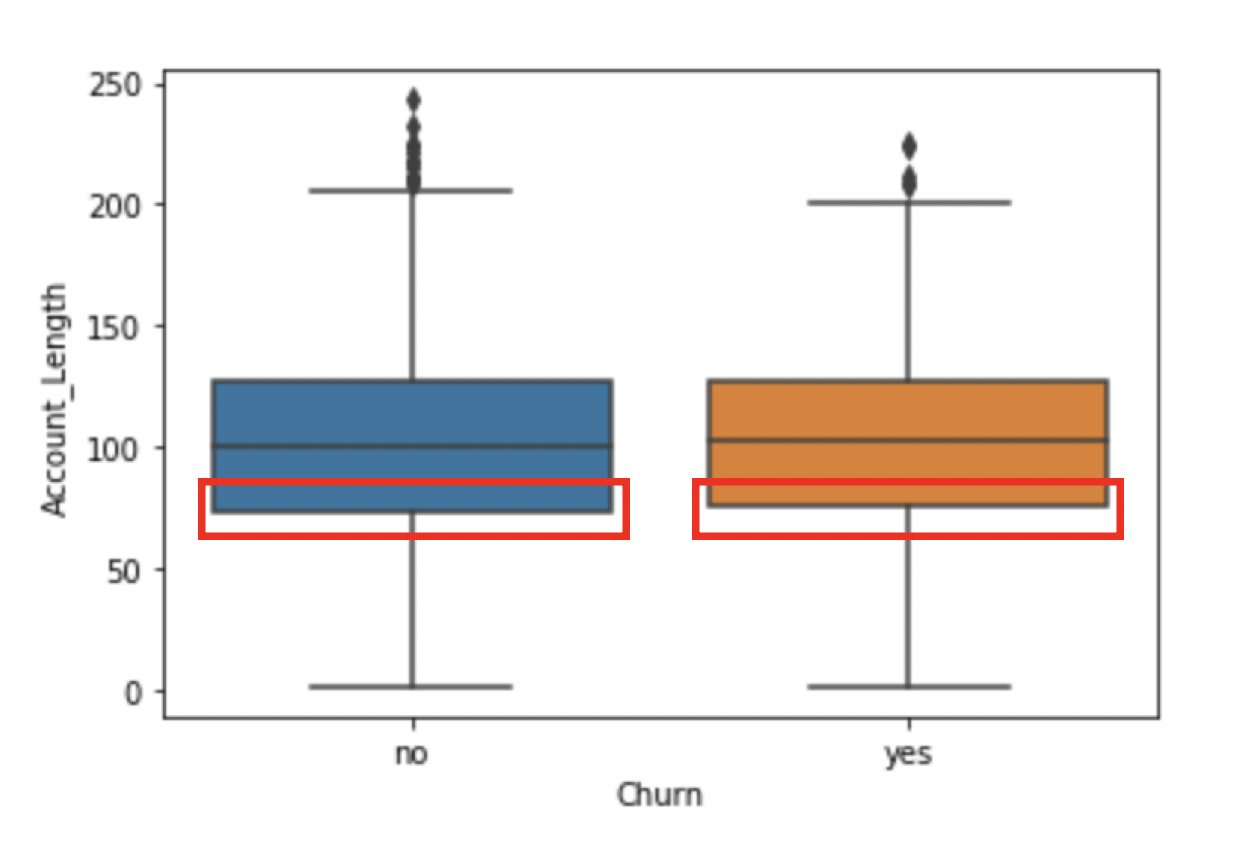
sns.boxplot(x = 'Churn',
y = 'Account_Length',
data = telco)
plt.show()

sns.boxplot(x = 'Churn',
y = 'Account_Length',
data = telco)
plt.show()

sns.boxplot(x = 'Churn',
y = 'Account_Length',
data = telco)
plt.show()

sns.boxplot(x = 'Churn',
y = 'Account_Length',
data = telco)
plt.show()

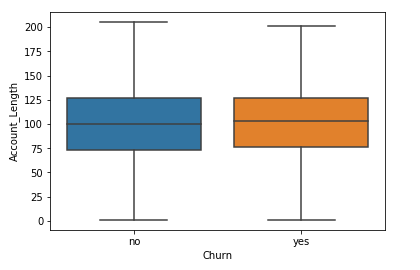
sns.boxplot(x = 'Churn',
y = 'Account_Length',
data = telco,
sym="")
plt.show()

sns.boxplot(x = 'Churn',
y = 'Account_Length',
data = telco,
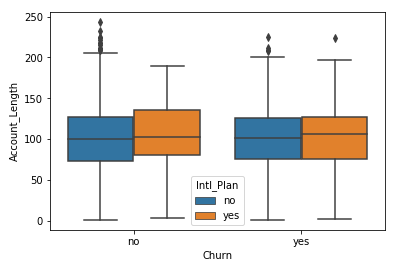
hue = 'Intl_Plan')
plt.show()

Marketinganalyse: klantverloop voorspellen in Python