Hoe visualisatie werkt in Python
Python voor spreadsheetgebruikers

Chris Cardillo
Data Scientist
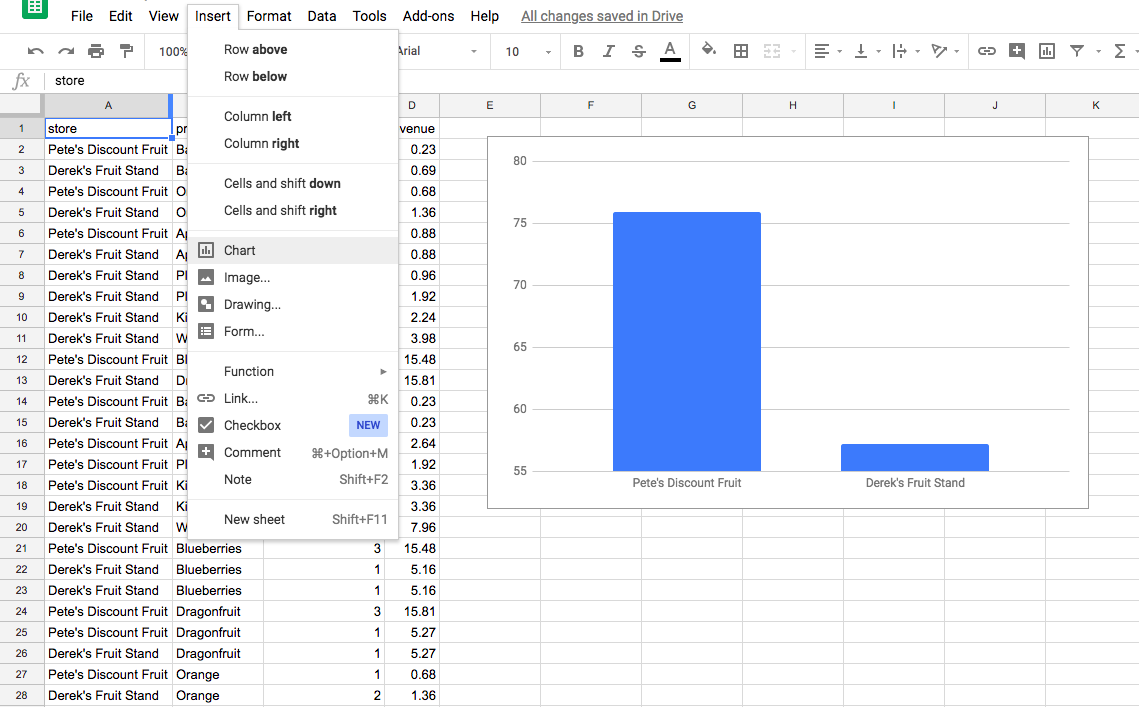
Spreadsheetgrafieken
Python-grafieken
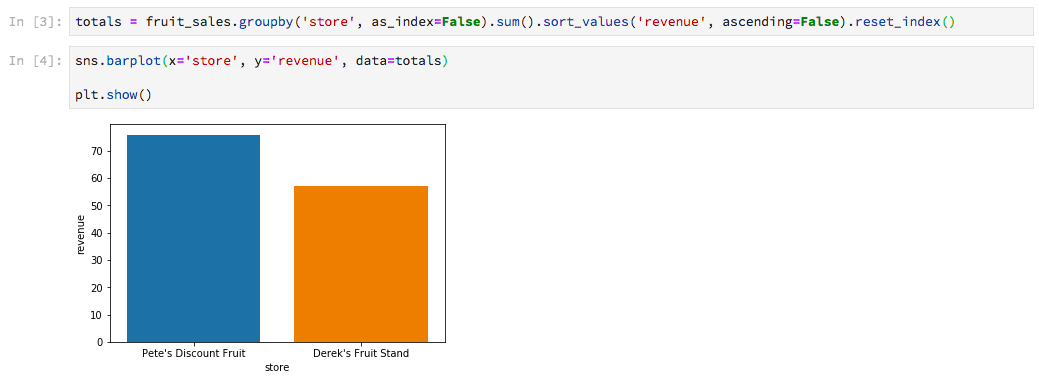
plt.show()
sns.barplot(x='store', y='revenue', data=totals)

plt.show()
Python voor spreadsheetgebruikers
Chris Cardillo
Data Scientist
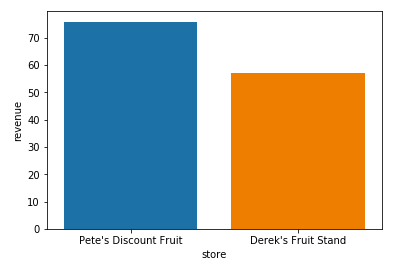
sns.barplot(x='store', y='revenue', data=totals)
plt.show()

