Effectgrootte
Basis van inferentie in Python

Paul Savala
Assistant Professor of Mathematics
Wat is effectgrootte?

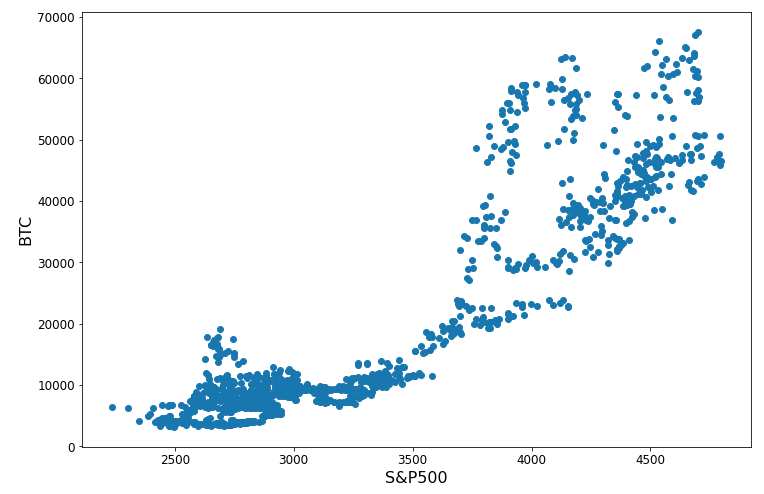
- Effectgrootte: maat voor de sterkte tussen twee variabelen

Effectgrootte bij correlatie
Cramers V berekenen

1 https://en.wikipedia.org/wiki/Degrees_of_freedom_(statistics)
Cramers V interpreteren
Cramer's V = 0.52, Degrees of Freedom = 1
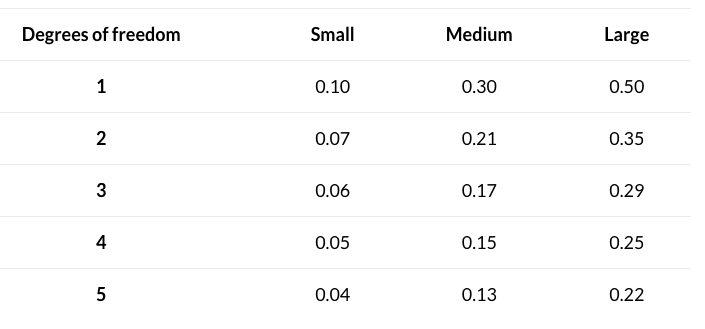
1 https://www.statology.org/interpret-cramers-v

