Veelvoorkomende textmining-visuals

Text mining met bag-of-words in R

Ted Kwartler

Instructor

Waarom visuals maken?

  • Goede visuals leiden snel tot conclusies
  • Het brein verwerkt visuele info efficiënt
Text mining met bag-of-words in R

De context schetsen

tweet_topics.png

Text mining met bag-of-words in R

De context schetsen

vector.png

Text mining met bag-of-words in R

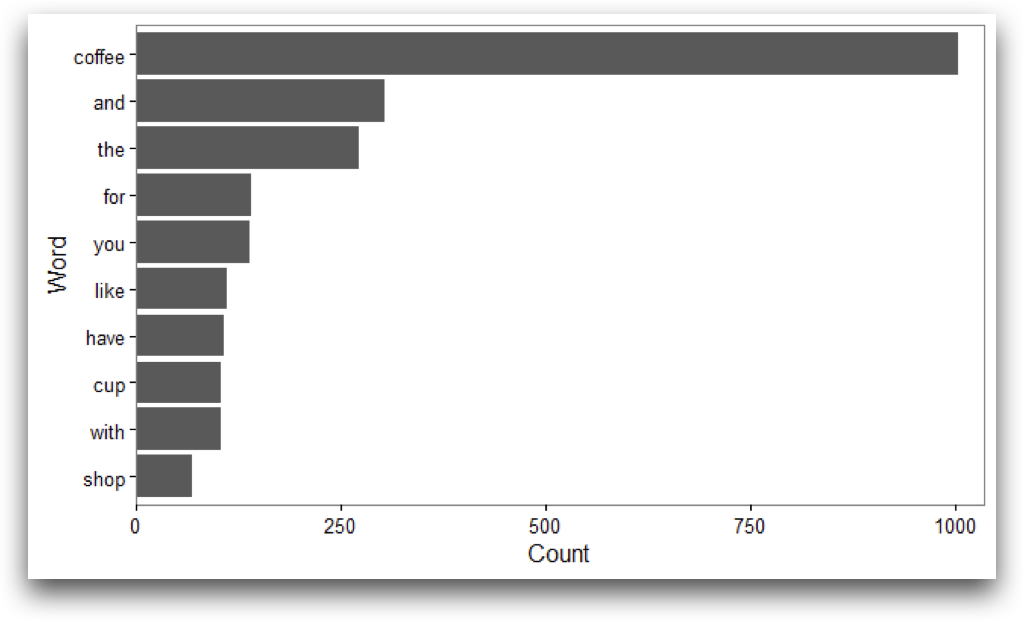
Termfrequentieplots met tm

# Convert TDM to matrix
coffee_m <- as.matrix(coffee_tdm)

# Sum rows and sort by frequency term_frequency <- rowSums(coffee_m) term_frequency <- sort(term_frequency, decreasing = TRUE)
# Create a barplot barplot(term_frequency[1:10], col = "tan", las = 2)

tf_plot.png

Text mining met bag-of-words in R

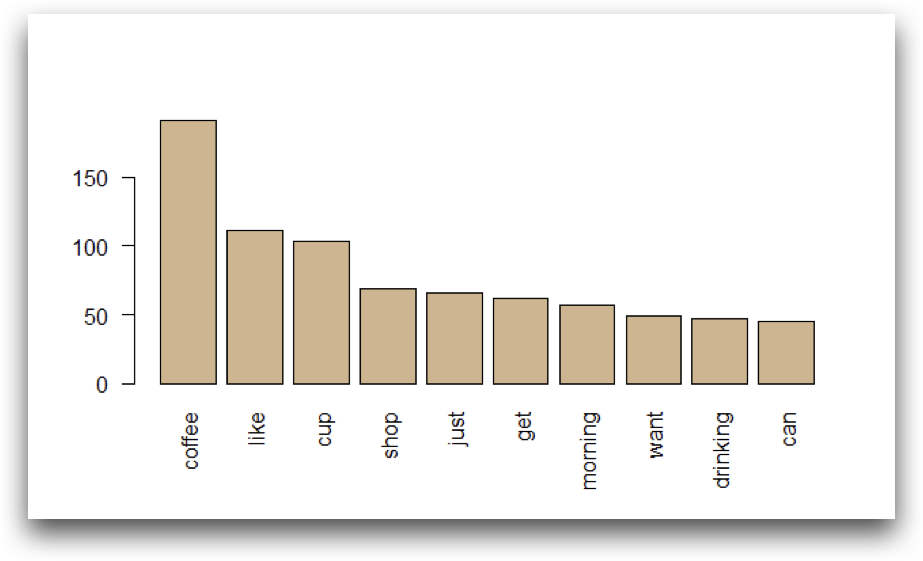
Termfrequentieplots met qdap

# Load qdap package
library(qdap)

# Find term frequencies frequency <- freq_terms( tweets$text, top = 10, at.least = 3, stopwords = "Top200Words" )
# Plot term frequencies plot(frequency)


qdap_plot.png

Text mining met bag-of-words in R

Laten we oefenen!

Text mining met bag-of-words in R

Preparing Video For Download...