Ratio’s visualiseren voor analyse binnen één bedrijf
Financiële overzichten analyseren in Python

Rohan Chatterjee
Risk modeler
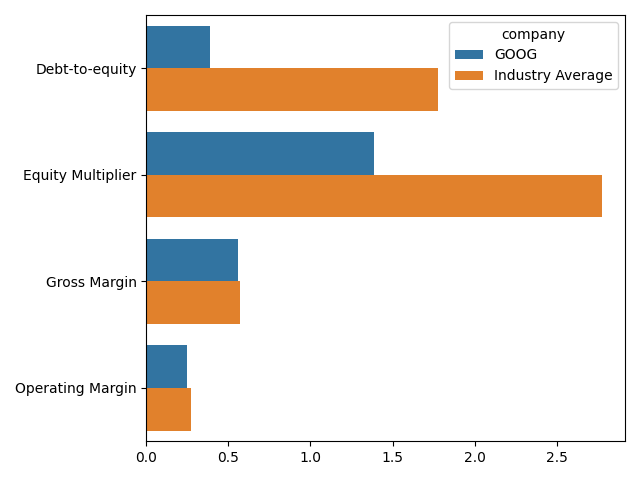
Financiële ratio’s visualiseren
- Staafdiagrammen zijn handig om
- financiële ratio’s per bedrijf te visualiseren, en
- prestaties t.o.v. het branchegemiddelde te beoordelen
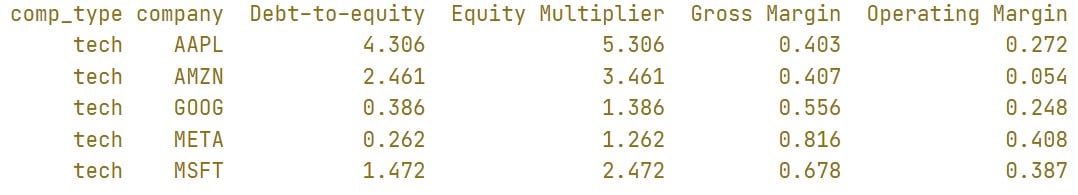
Data voorbereiden voor de plot
- Gebruik
pivot_tableom gemiddelde ratio’s per bedrijf te berekenen:avg_company_ratio = plot_dat.pivot_table(index=["comp_type", "company"], values=["Gross Margin", "Operating Margin", "Debt-to-equity", "Equity Multiplier"], aggfunc="mean").reset_index() print(avg_company_ratio.head())
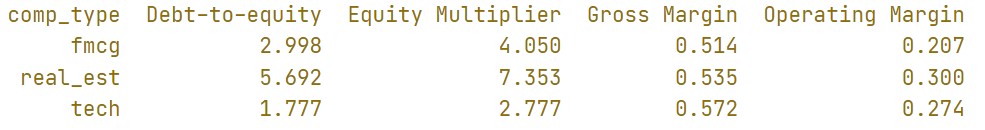
Data voorbereiden voor de plot
- Gebruik
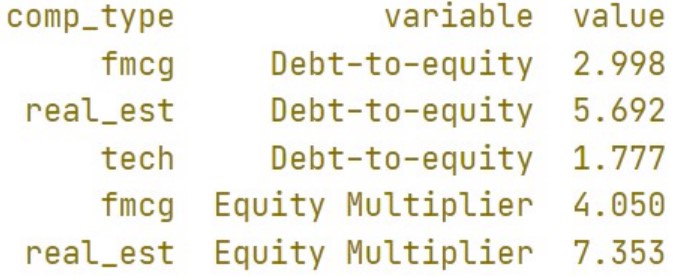
pivot_tableom gemiddelde ratio’s per branche te berekenen:avg_industry_ratio = plot_dat.pivot_table(index="comp_type", values=["Gross Margin", "Operating Margin", "Debt-to-equity", "Equity Multiplier"], aggfunc="mean").reset_index() print(avg_industry_ratio.head())
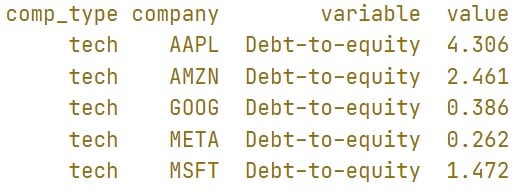
print(molten_plot_company.head())
print(molten_plot_industry.head())
Maak het staafdiagram
sns.barplot(data=molten_plot, y="variable", x="value", hue="company", ci=None)
plt.xlabel(""), plt.ylabel("")
plt.show()

