Census Subject Tables

US Census-gegevens analyseren in Python

Lee Hachadoorian

Asst. Professor of Instruction, Temple University

Census Data Products

  • Decennial Census of Population and Housing
  • American Community Survey (annual)
  • Current Population Survey (monthly)
  • Economic Survey (5 years)
  • Annual Survey of State and Local Government Finances
US Census-gegevens analyseren in Python

Course Prerequisites

  • Lists
  • Dictionaries
  • Package imports
  • Control flow, looping
  • List comprehensions
  • pandas DataFrames
US Census-gegevens analyseren in Python

Introduction to Census Topics

Decennial Census of Population and Housing

  • Demographics (age, sex, race, family structure)
  • Housing Occupancy and Ownership (vacant/occupied, rent/own)
  • Group Quarters Population (prisons, college dorms)

American Community Survey

  • Educational Attainment
  • Commuting (mode, time leaving, time travelled)
  • Disability Status
US Census-gegevens analyseren in Python

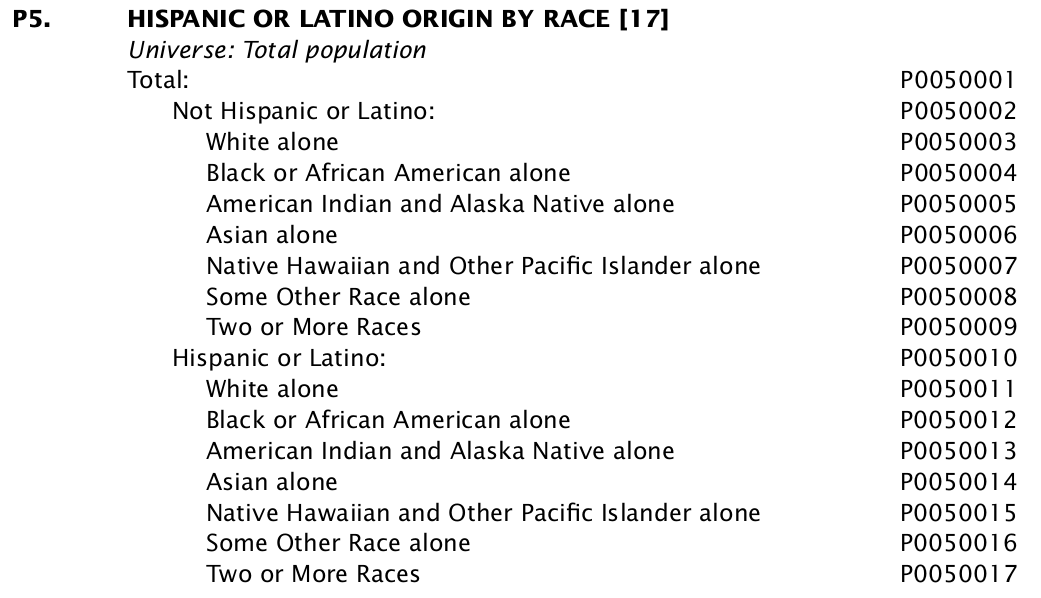
Structure of a Subject Table

A listing of variables in the subject table P5 - "Hispanic or Latino Origin by Race"

US Census-gegevens analyseren in Python

Subject Table to DataFrame

states.head()
               total          ...           hispanic_multiracial
Alabama      4779736          ...                          10806
Alaska        710231          ...                           6507
Arizona      6392017          ...                         103669
Arkansas     2915918          ...                          11173
California  37253956          ...                         846688

[5 rows x 17 columns]
US Census-gegevens analyseren in Python

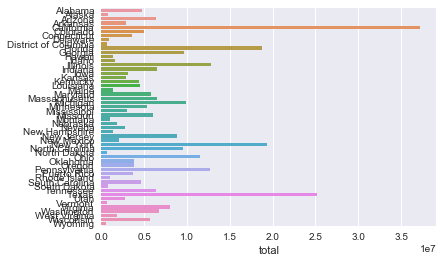
Basic Data Visualization

import seaborn as sns

sns.set()
sns.barplot( x = "total", y = states.index, data = states )

Going further: Data Visualization with Seaborn

A plot showing bars proportional in length to the total population of each state.

US Census-gegevens analyseren in Python

Let's practice!

US Census-gegevens analyseren in Python

Preparing Video For Download...