Buurtsegregatie in de tijd
US Census-gegevens analyseren in Python

Lee Hachadoorian
Asst. Professor of Instruction, Temple University
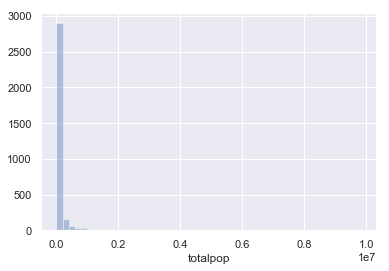
Histogrammen
sns.distplot(counties["totalpop"],
             kde = False)
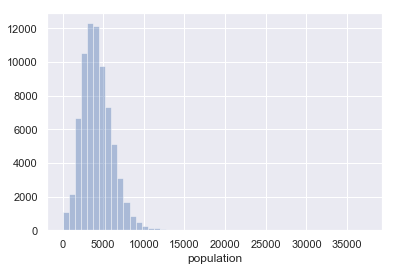
Histogrammen
sns.distplot(tracts["totalpop"],
             kde = False)

IPUMS NHGIS, University of Minnesota, www.nhgis.org

