Pearson-correlatie

A/B-testen in R

Lauryn Burleigh

Data Scientist

Aannames van Pearson-correlatie

  • Correlatietest kiezen: eigenschappen van data
  • Pearson-correlatie
    • Lineair
    • Normale verdeling

Lineaire lijn in grafiek stijgt van linksonder naar rechtsboven.

Grafiek van de standaardnormale verdeling.

A/B-testen in R

Pearson-correlatie en A/B-tests

  • Groep A: kaaspizza
  • Groep B: pepperonipizza


  • Relatie tussen eettijd en plezier

Groepen negeren

  • Nullhypothese: geen relatie tussen eettijd en plezier

Per groep

  • Nullhypothese: geen relatie tussen eettijd en plezier bij de kaaspizza
  • Nullhypothese: geen relatie tussen eettijd en plezier bij de pepperonipizza
A/B-testen in R

Steekproefgrootte bepalen

  • r verwachte effectgrootte (via cor())
  • sig.level waarop we H0 verwerpen
library(pwr)
pwr.r.test(r = 0.3, power = 0.80, 
           sig.level = 0.05)
    approximate correlation power 
 calculation (arctangh transformation) 

              n = 84.07364
              r = 0.3
      sig.level = 0.05
          power = 0.8
    alternative = two.sided
A/B-testen in R

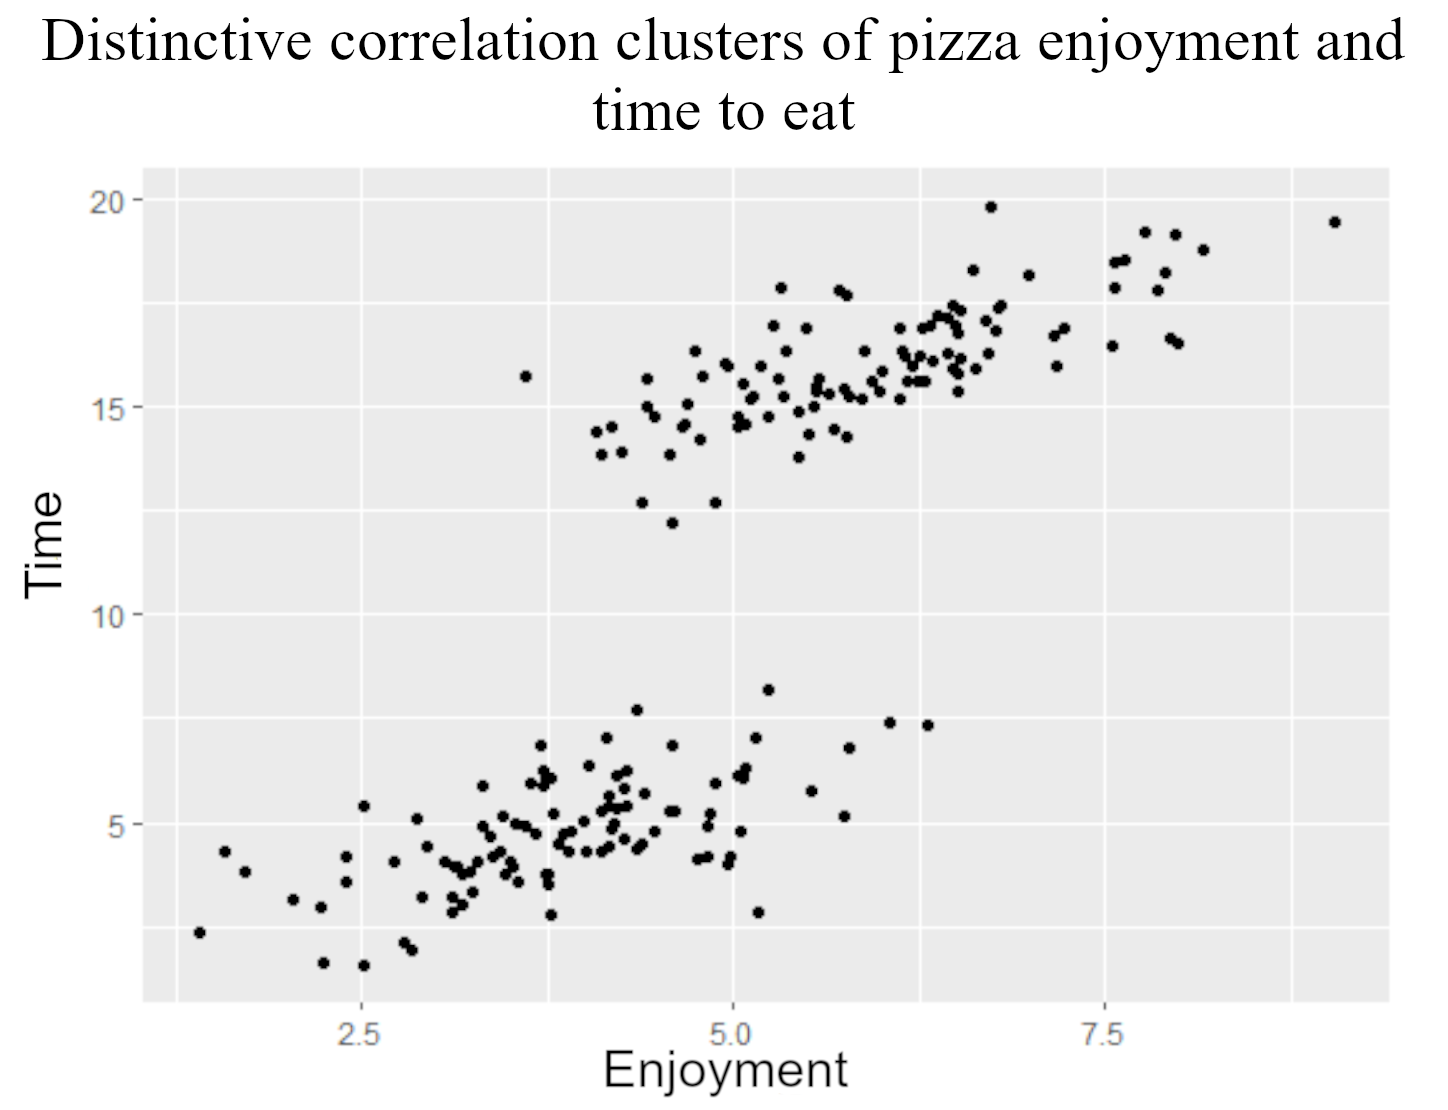
Lineariteit beoordelen

ggplot(pizza, aes(x = enjoyment, 
                  y = time)) + 
    geom_point()

Spreidingsdiagram met een positieve lineaire relatie tussen plezier (x-as) en tijd (y-as).

ggplot(pizza, aes(x = enjoyment, 
                  y = time)) + 
    geom_point()

Spreidingsdiagram met een positieve lineaire relatie tussen plezier (x-as) en tijd (y-as), met één cluster linksonder en een duidelijk ander cluster rechtsboven.

A/B-testen in R

Normaliteit beoordelen

shapiro.test(pizza$time)
    Shapiro-Wilk normality test
data:  pizza$time
W = 0.98686, p-value = 0.4282
  • Data zijn normaal
shapiro.test(pizza$enjoyment)
    Shapiro-Wilk normality test
data:  pizza$enjoyment
W = 0.98916, p-value = 0.5971
  • Data zijn normaal
A/B-testen in R

Pearson zonder groepen

cor.test(~ time + enjoyment, 
         data = pizza, 
         method = "pearson")


Variantiedeeltje: cor^2

0.30^2
[1] 0.09
Pearson's product-moment correlation

data:  time and enjoyment
t = 22.304, df = 88, p-value = 0.0218
alternative hypothesis: true correlation
is not equal to 0
95 percent confidence interval:
 0.8833166 0.9479256
sample estimates:
      cor 
0.3021878
A/B-testen in R

Pearson binnen groepen

cor.test(~ time + enjoyment, 
         data = pizza, 
         subset = 
             (Topping == "Cheese"),
         method = "pearson")
Pearson's product-moment correlation

data:  Time and Enjoy
t = 11.121, df = 98, p-value < 2.2e-16
alternative hypothesis: true correlation 
is not equal to 0
95 percent confidence interval:
 0.6451710 0.8226595
sample estimates:
     cor 
0.746935 
A/B-testen in R

Poweranalyse

Pearson zonder groepen:

Pearson's product-moment correlation

data:  time and enjoyment
t = 22.304, df = 88, p-value = 0.0218
alternative hypothesis: true 
correlation is not equal to 0
95 percent confidence interval:
 0.8833166 0.9479256
sample estimates:
      cor 
0.3021878
library(pwr)
pwr.r.test(r = 0.302, n = 100, 
           sig.level = 0.022)
     approximate correlation power 
  calculation (arctangh transformation) 

              n = 100
              r = 0.302
      sig.level = 0.022
          power = 0.7853514
    alternative = two.sided
A/B-testen in R

Laten we oefenen!

A/B-testen in R

Preparing Video For Download...