Werken met lijsten
R voor SAS-gebruikers

Melinda Higgins, PhD
Research Professor/Senior Biostatistician Emory University
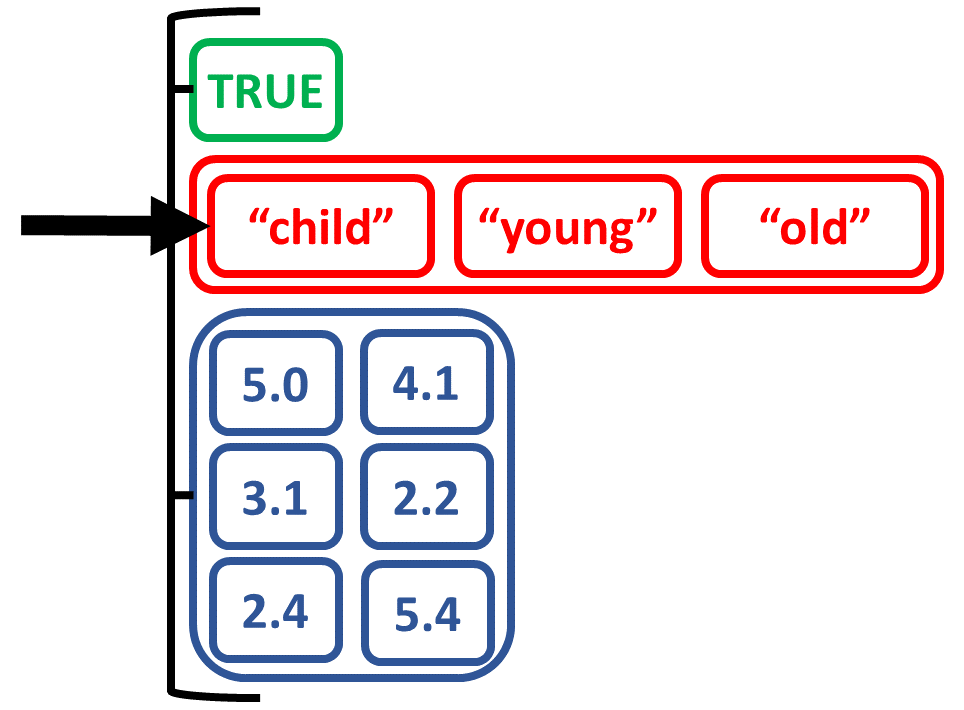
Maak een lijst door andere objecten te combineren

Maak een lijst door andere objecten te combineren
Maak een lijst door andere objecten te combineren
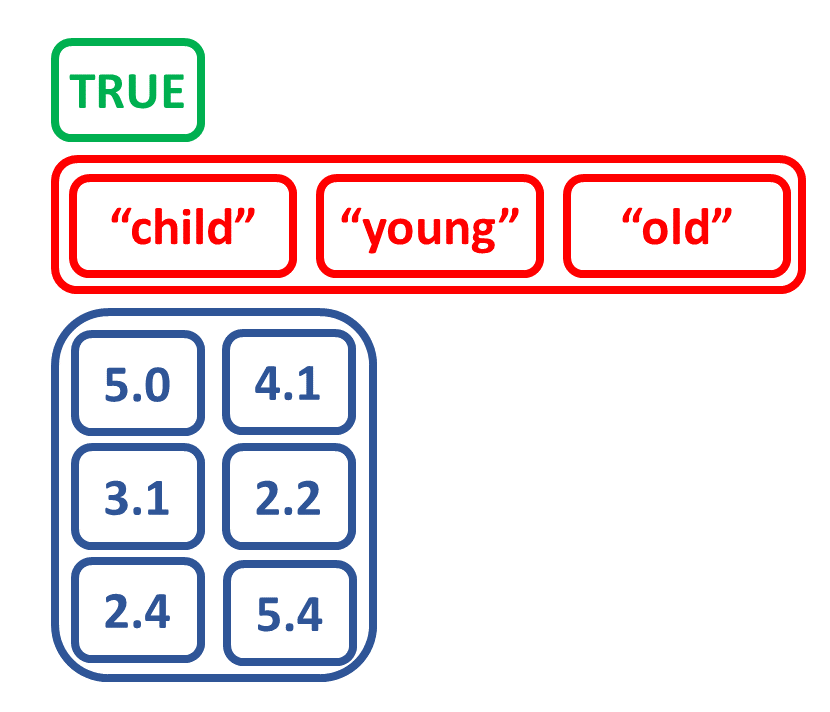
Maak een lijst van objecten van verschillende types

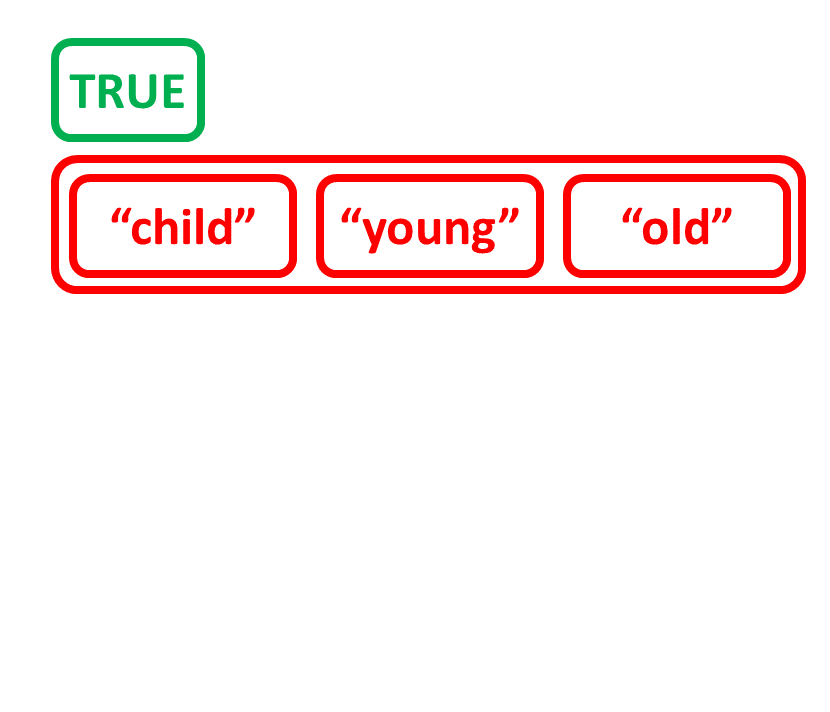
Selecteer elementen uit een lijst op naam