Correlaties en t-toetsen
R voor SAS-gebruikers

Melinda Higgins, PhD
Research Professor/Senior Biostatistician Emory University
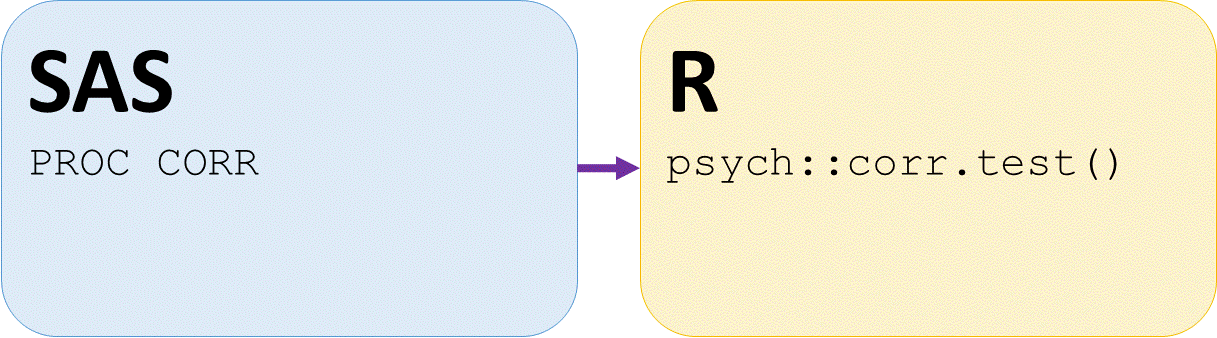
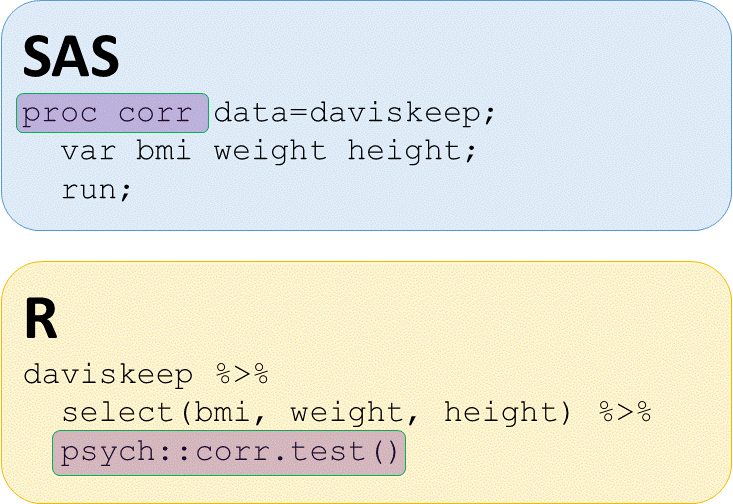
Correlaties: SAS vs. R
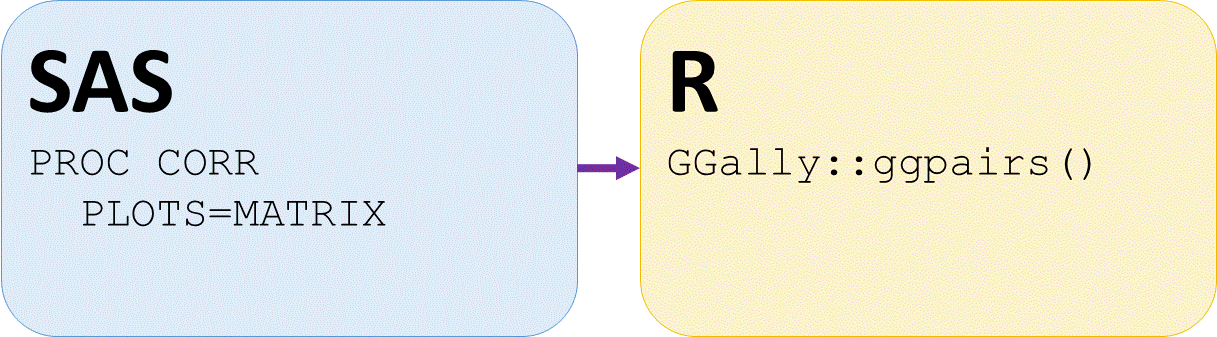
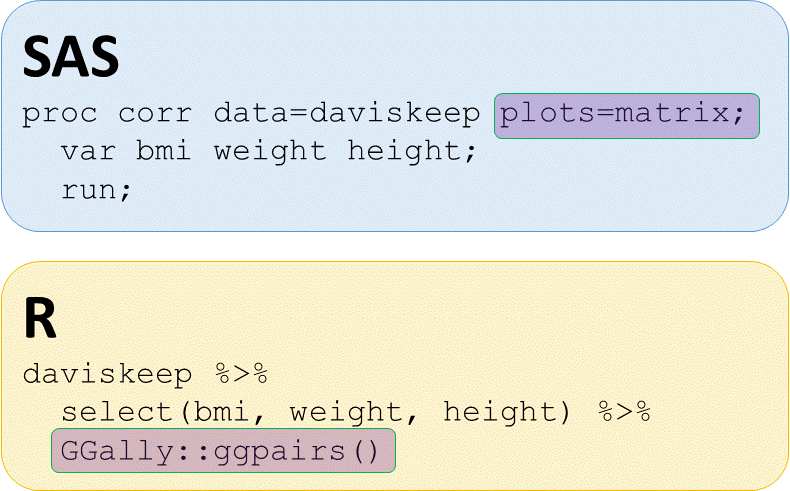
Scatterplotmatrix in SAS en R
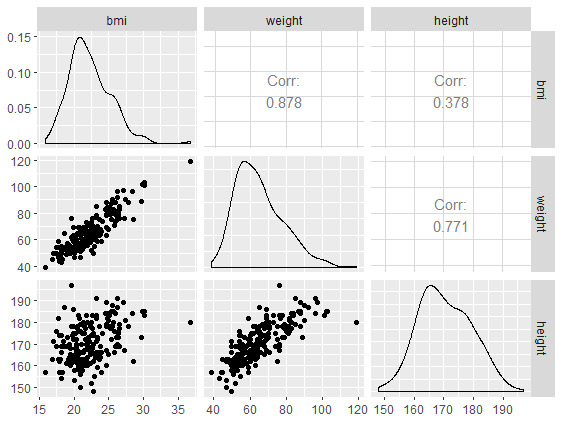
Scatterplotmatrix - functie GGally::ggpairs()
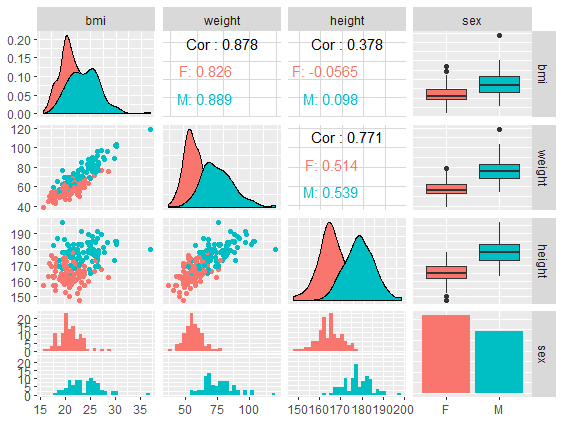
Scatterplotmatrix - ggpairs per groep
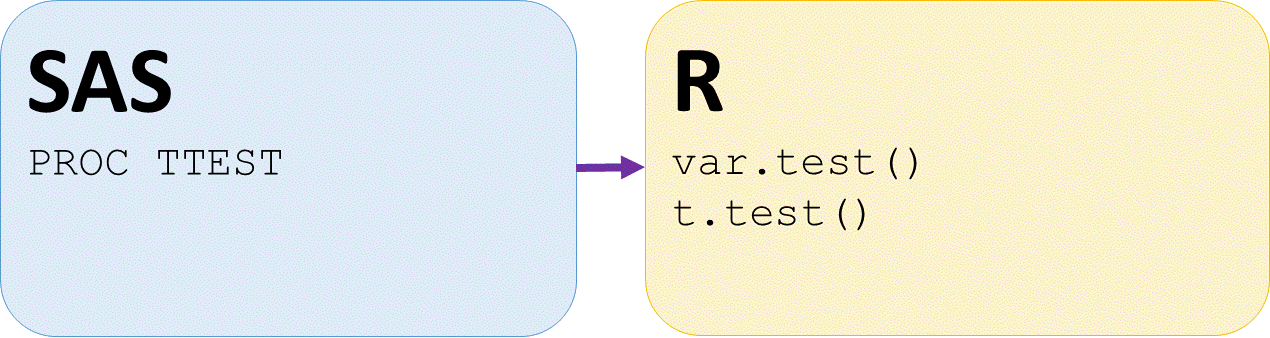
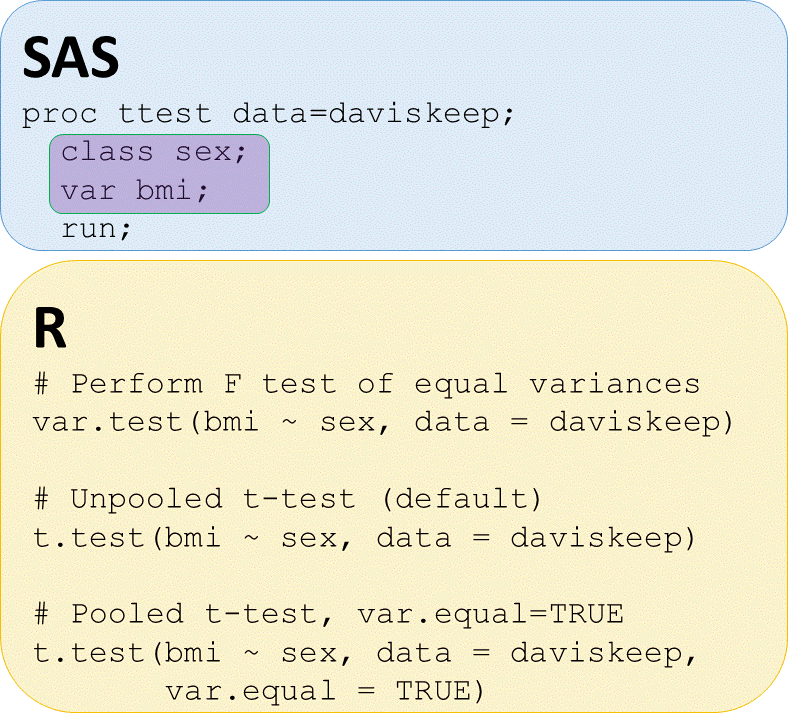
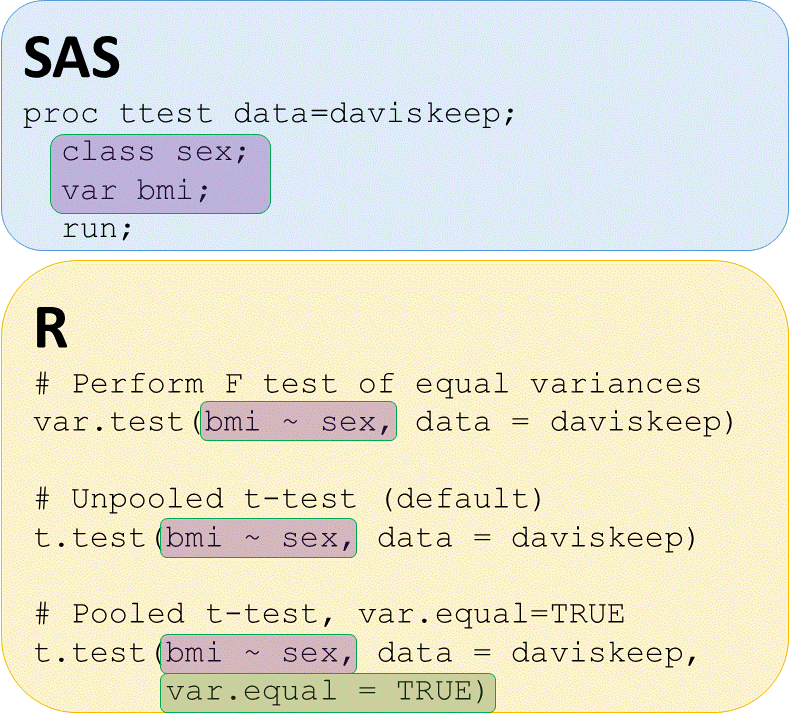
t-toetsen in SAS en R