Categorische data: analyseren en visualiseren
R voor SAS-gebruikers

Melinda Higgins, PhD
Research Professor/Senior Biostatistician Emory University
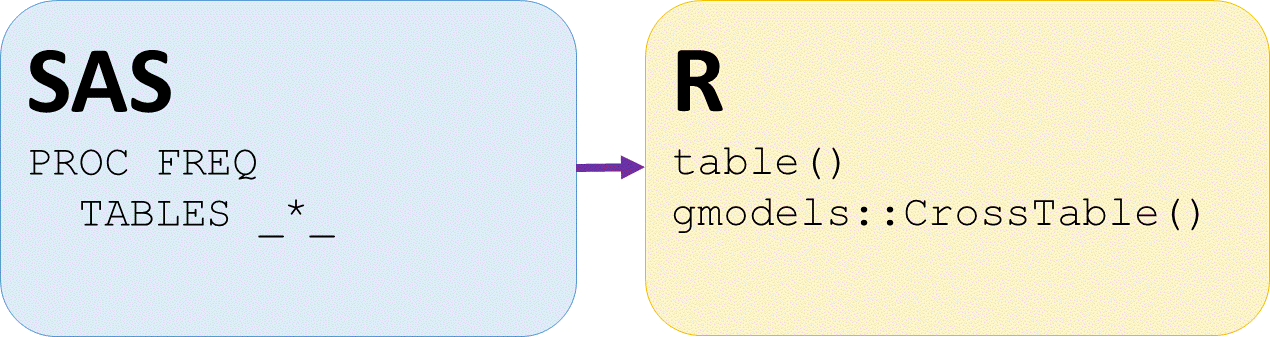
Contingentietabellen in SAS en R
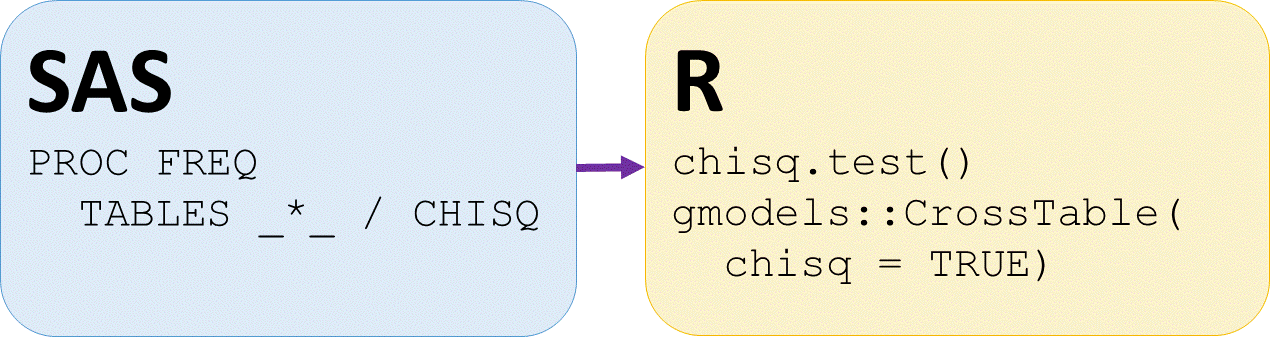
Chi-kwadraattoetsen in SAS en R
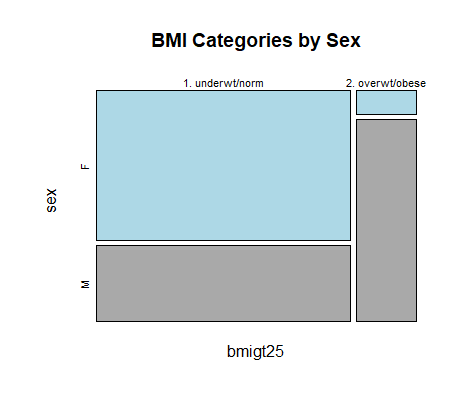
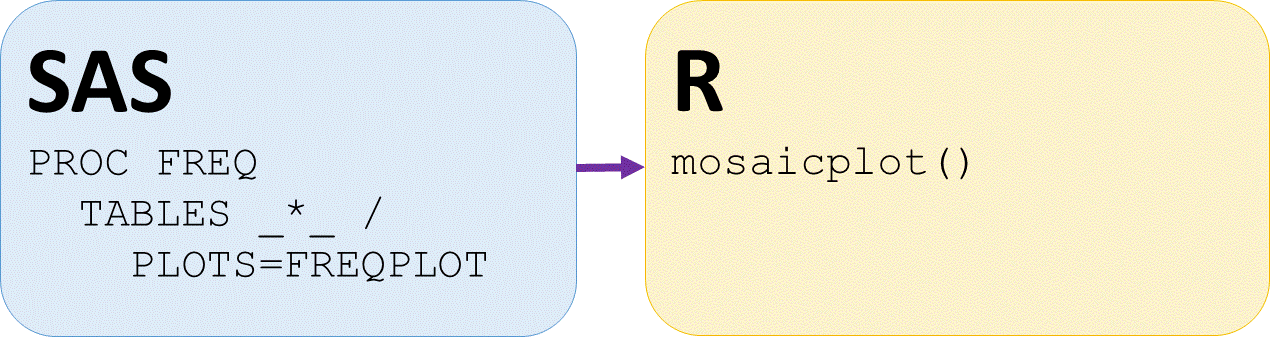
Mozaïekplots in SAS en R
Mozaïekplot van tweedelige categorische verhoudingen