Obligatiekoersen vs. rendementen
Waardering en analyse van obligaties in Python

Joshua Mayhew
Options Trader
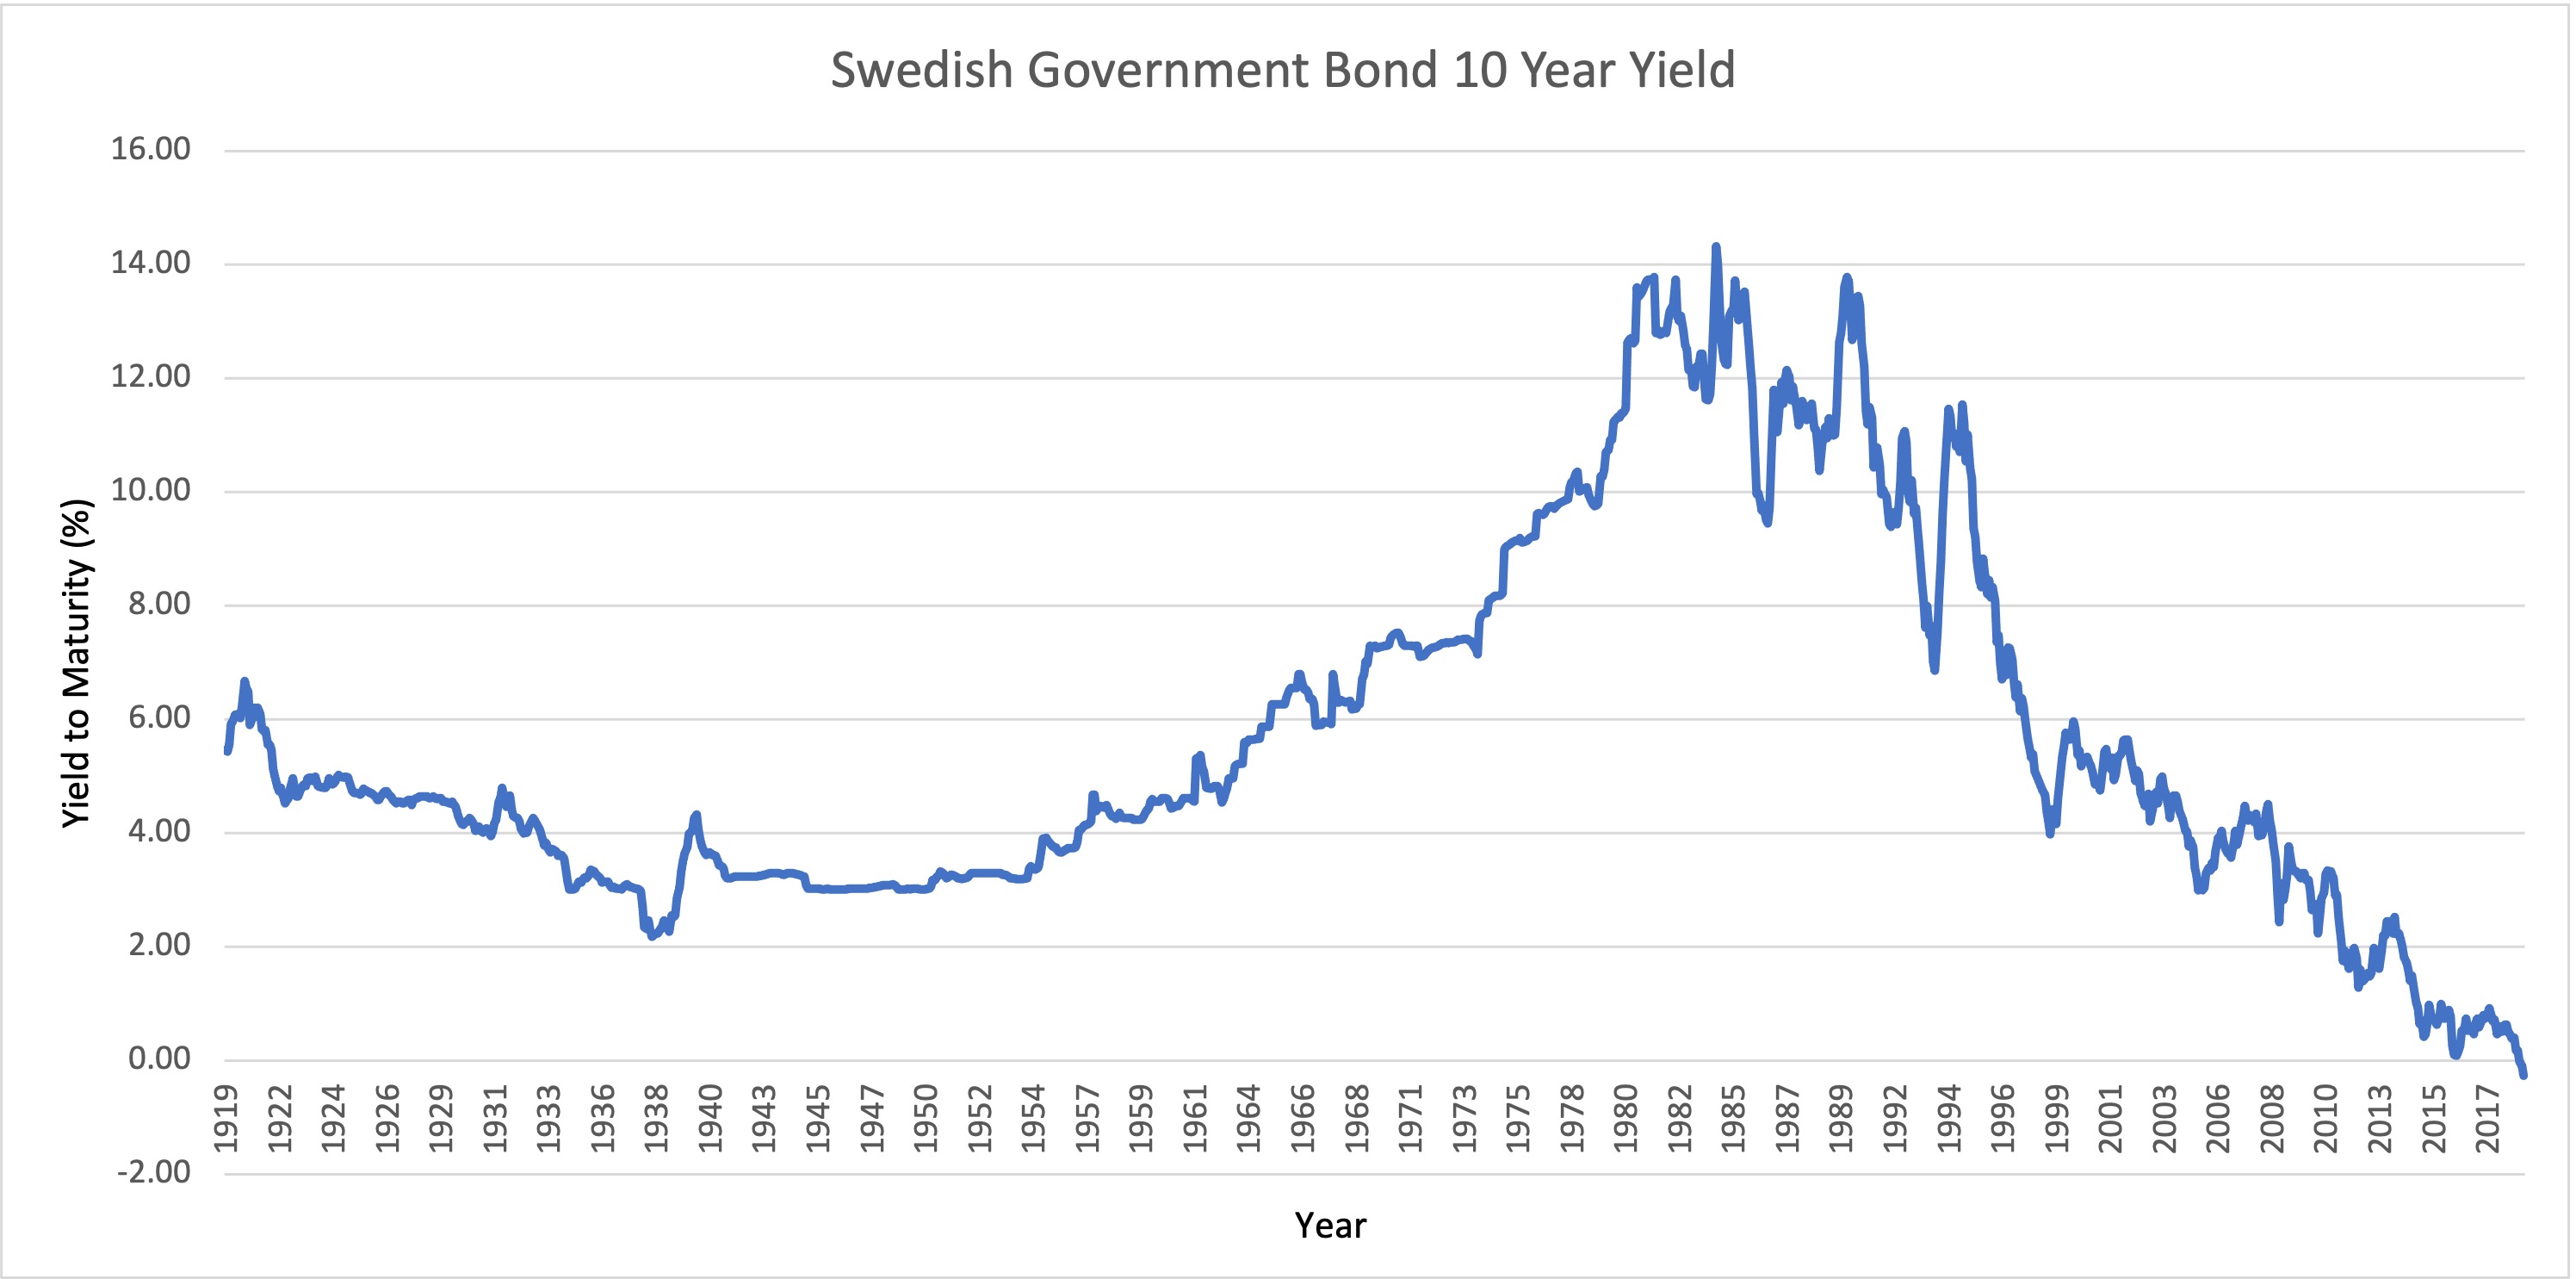
Historische staatsrentes
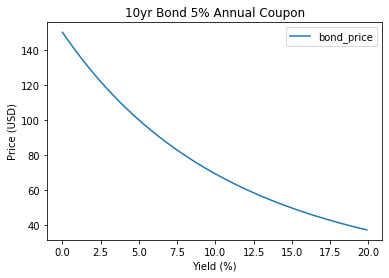
Koersen vs. rendementen plotten
plt.plot(bond['bond_yield'], bond['bond_price'])plt.xlabel('Yield (%)')plt.ylabel('Bond Price (USD)')plt.title("10 Year Bond 5% Annual Coupon")plt.show()
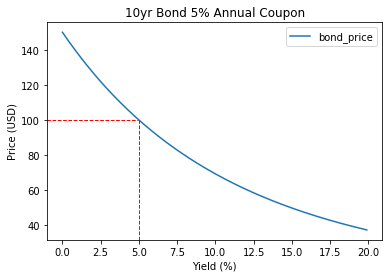
De relatie tussen koers en rendement
De relatie tussen koers en rendement
De relatie tussen koers en rendement
De relatie tussen koers en rendement

