Incrementele data voorbereiden en visualiseren

IoT-gegevens analyseren in Python

Matthias Voppichler

IT Developer

Data voorbereiden

  • Data pivoteren
  • Resamplen
  • diff() toepassen
  • pct_change() toepassen
IoT-gegevens analyseren in Python

Datastructuur

print(data.head())
                timestamp device   value
0 2018-10-26 06:30:42.817   C331  6020.0
1 2018-10-26 06:30:43.083   M640   104.0
2 2018-10-26 06:31:00.858   M640   126.0
3 2018-10-26 06:31:10.254   C331  6068.0
4 2018-10-26 06:31:10.474   M640   136.0
IoT-gegevens analyseren in Python

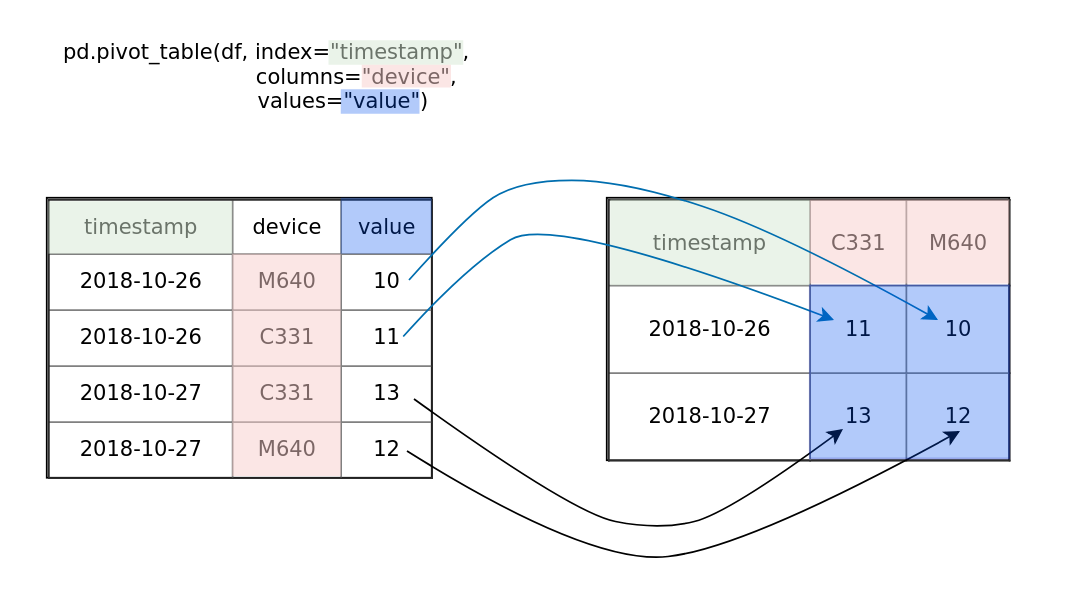
Draaitabel

Plot die een draaitabel uitlegt

IoT-gegevens analyseren in Python

Draaitabel toepassen

                timestamp device   value
0 2018-10-26 06:30:42.817   C331  6020.0
1 2018-10-26 06:30:43.083   M640   104.0
2 2018-10-26 06:31:00.858   M640   126.0
3 2018-10-26 06:31:10.254   C331  6068.0
4 2018-10-26 06:31:10.474   M640   136.0
data = pd.pivot_table(data, columns="device", values="value", index="timestamp")
print(data.head()
device                     C331   M640
timestamp                             
2018-10-26 06:30:42.817  6020.0    NaN
2018-10-26 06:30:43.083     NaN  104.0
2018-10-26 06:31:00.858     NaN  126.0
2018-10-26 06:31:10.254  6068.0    NaN
2018-10-26 06:31:10.474     NaN  136.0
IoT-gegevens analyseren in Python

Resamplen

# DataFrame resamplen naar 1 min
df = data.resample("1min").max().dropna()
print(df.head())
device                 C331   M640
timestamp                         
2018-10-26 06:30:00  6020.0  104.0
2018-10-26 06:31:00  6129.0  180.0
2018-10-26 06:32:00  6205.0  256.0
2018-10-26 06:33:00  6336.0  332.0
2018-10-26 06:34:00  6431.0  402.0
IoT-gegevens analyseren in Python

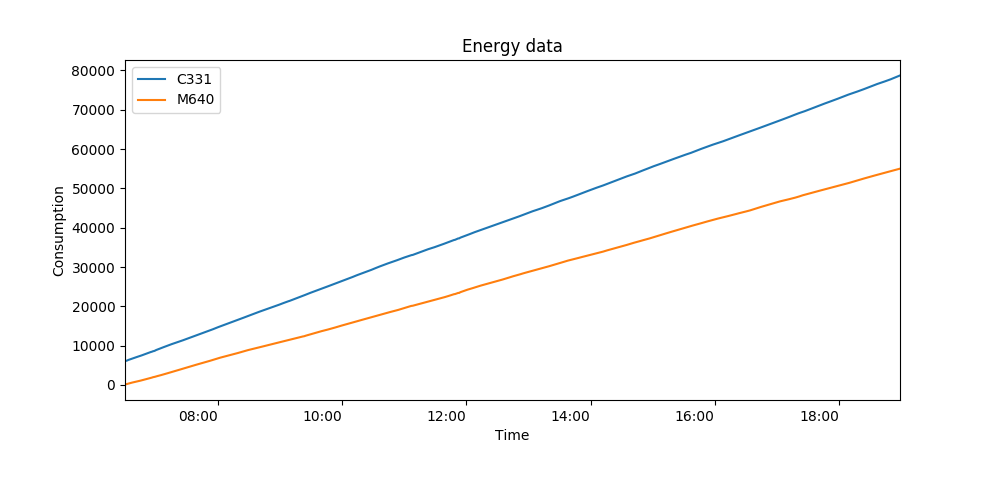
Data visualiseren

data.plot()
plt.show()
IoT-gegevens analyseren in Python

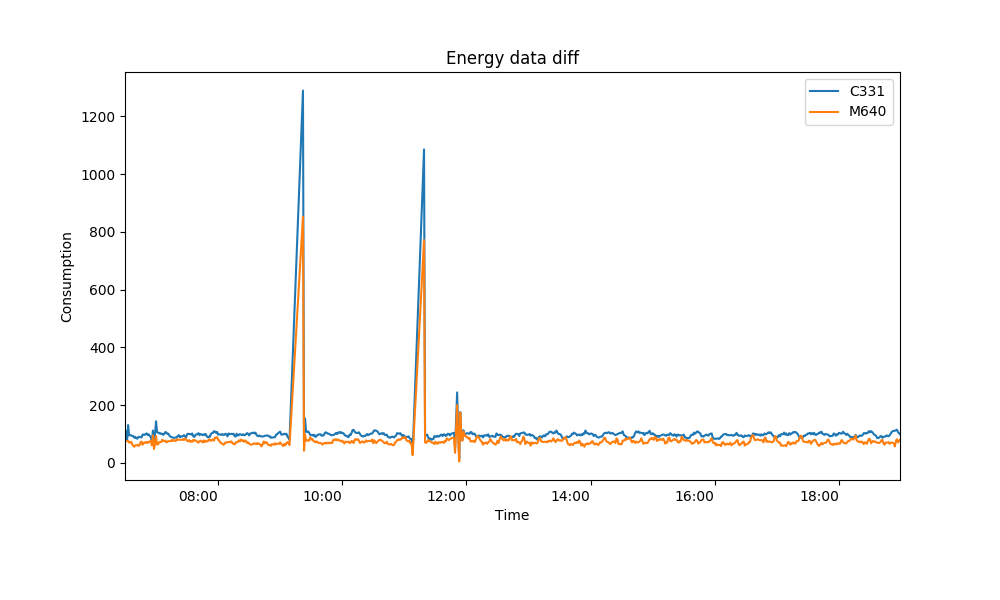
pd.diff()

# Verschil
df_diff = data.diff(1)
df_diff.plot()
plt.show()
IoT-gegevens analyseren in Python

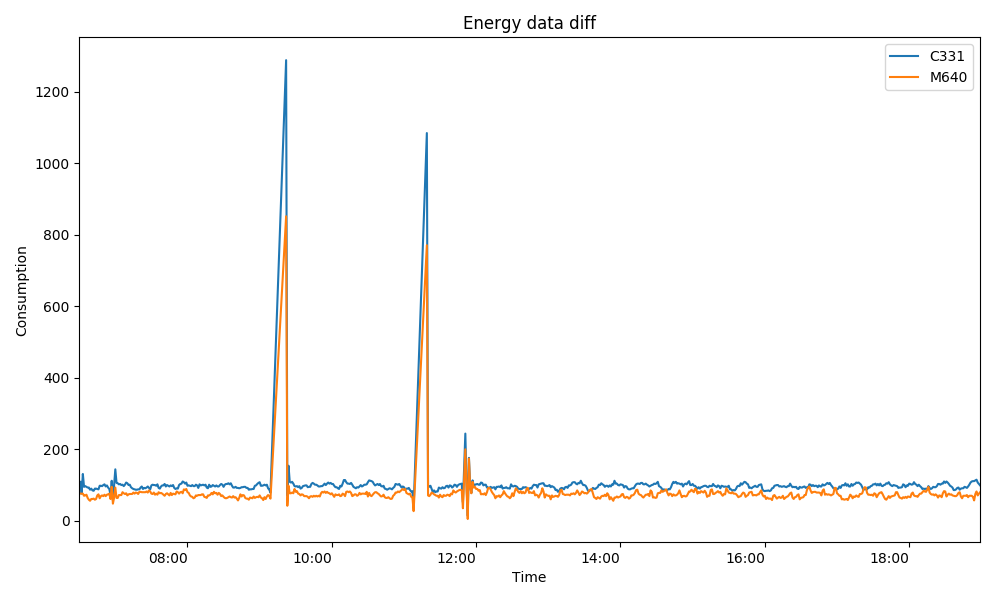
Data-analyse - verschil

# Verschil
df_diff = data.diff()
df_diff.plot()
plt.show()
 

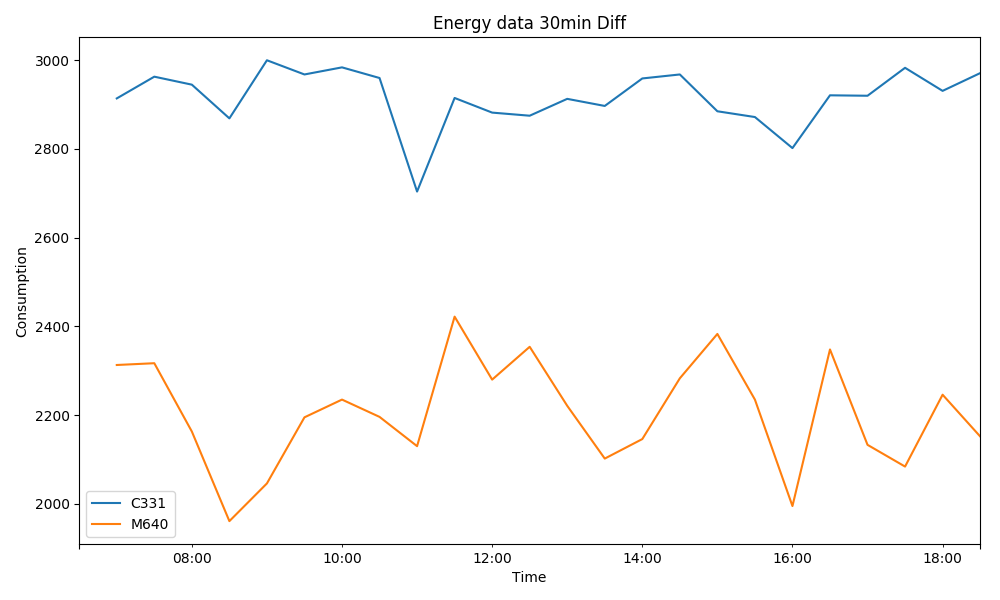
# Verschil na resampling
df = data.resample('30min').max()
df_diff = df.diff()
df_diff.plot()
plt.show()
IoT-gegevens analyseren in Python

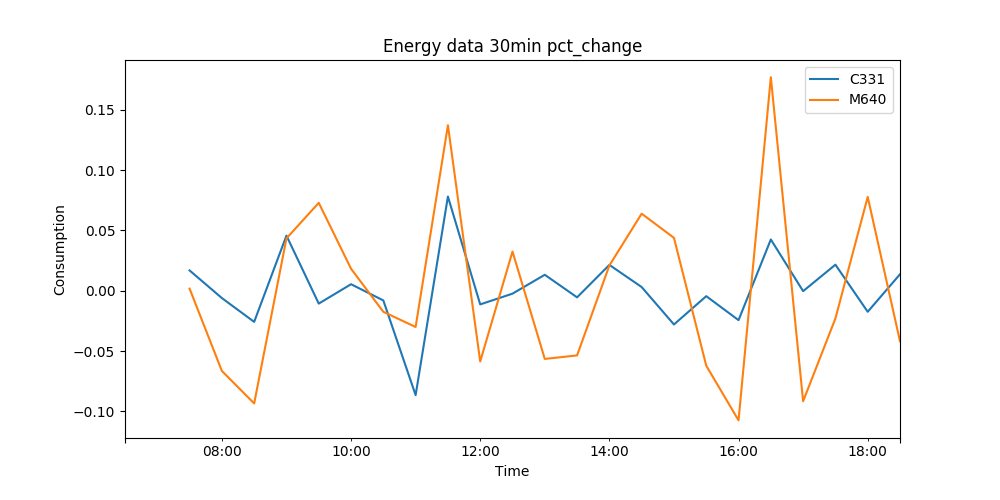
Procentuele verandering

df_pct = df_diff.pct_change()
df_pct.plot()
IoT-gegevens analyseren in Python

Laten we oefenen!

IoT-gegevens analyseren in Python

Preparing Video For Download...