Twitter-trends
Socialemediagegevens analyseren in R

Vivek Vijayaraghavan
Data Science Coach
Lesoverzicht
- Begrijp twitter-trends
- Haal trending topics op
- Gebruik trends voor bereik en engagement
Wat is een twitter-trend?
- Trefwoorden, events of topics die nu populair zijn
- Ontdek de heetste opkomende gespreksonderwerpen
- Sommige trends hebben een hashtag
- Hashtags helpen trending gesprekken vinden
- Locatietrends tonen topics op een specifieke plek
De kracht van twitter-trends benutten
- Verbind marketingboodschappen met een trending topic
- Trends verhogen tweet-engagement
- Reisplatform tweet rond "#TravelTuesday"
Wereldwijde trends ophalen
# Haal algemene huidige trending topics op
trend_topics <- get_trends()
head(trend_topics$trend, 10)
 [1] "#madebygoogle"         "#あなたとHしたい人の数"
 [3] "西田くん"                "Jennifer Aniston"
 [5] "#ワールドカップバレー"     "#FelizMartes"
 [7] "#G線上のあなたと私"       "西田選手"
 [9] "피디수첩"                "タジキスタン"
- Zinvoller: trends uit een specifieke regio halen
Locaties met actuele trends
# Locaties met beschikbare twitter-trends ophalen
trends_avail <- trends_available()
head(trends_avail)
name                        url                          parentid    country
<chr>                      <chr>                           <int>      <chr>
Worldwide     http://where.yahooapis.com/v1/place/1
Winnipeg      http://where.yahooapis.com/v1/place/2972    23424775    Canada
Ottawa        http://where.yahooapis.com/v1/place/3369    23424775    Canada
Quebec        http://where.yahooapis.com/v1/place/3444    23424775    Canada
Montreal      http://where.yahooapis.com/v1/place/3534    23424775    Canada
Toronto       http://where.yahooapis.com/v1/place/4118    23424775    Canada
Trending topics per land
# Haal trending topics in de VS op
gt_US <- get_trends("United States")
Trending topics per land
View(gt_US)
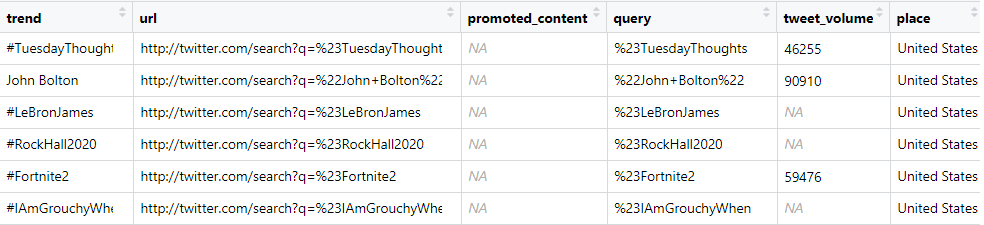
- Muziekvideobedrijf kan promoties richten op "hashtagRockHall2020"
Trending topics per stad
- Vind trends in een specifieke stad
- Koppel tweets aan een relevante trend
# Haal trending topics in New York op
gt_city <- get_trends("New York")
Trending topics per stad
head(gt_city)
trend                            url                        promoted_content
<chr>                           <chr>                             <lgl>
Lions            http://twitter.com/search?q=Lions                  NA
Green Bay        http://twitter.com/search?q=%22Green+Bay%22        NA
#DETvsGB         http://twitter.com/search?q=%23DETvsGB             NA
LeBron           http://twitter.com/search?q=LeBron                 NA
Aaron Rodgers    http://twitter.com/search?q=%22Aaron+Rodgers%22    NA
#90DayFiance     http://twitter.com/search?q=%2390DayFiance         NA
- Een bedrijf met basketbalmerch kan op deze trend inspelen
Meest getweete trends
tweet_volumebevat het aantal tweets over een trend- Alleen beschikbaar voor sommige trends
- Vind de meest getweete trends
Meest getweete trends
# Aggregeer trends en tweet-volumes
library(dplyr)
trend_df <- gt_city %>%
              group_by(trend) %>%
              summarize(tweet_vol = mean(tweet_volume))
Meest getweete trends
head(trend_df)
trend                  tweet_vol
<chr>                    <dbl>
#90DayFiance             14375
#acefamilyisoverparty    12760
#ascendwithme            NA
#bbcon2019               NA
#bookbirthday            NA
#DemDebate               18928
Meest getweete trends
# Sorteer dataframe aflopend op tweet-volume
trend_df_sort <- arrange(trend_df, desc(tweet_vol))
Meest getweete trends
# Bekijk de meest getweete trends
head(trend_df_sort)
trend              tweet_vol
<chr>               <dbl>
LeBron              298302
Lions               267945
Columbus Day        135014
John Bolton         118933
#DETvsGB            67197
#TuesdayThoughts    63259
- Reisbedrijf kan rond "Columbus Day" pakketten promoten
Laten we oefenen!
Socialemediagegevens analyseren in R

