Chi-kwadraattoets
Enquètegegevens analyseren in Python

EbunOluwa Andrew
Data Scientist
Chi-kwadraattoets
- Inferenties over de verdeling van een categorische variabele
- Vergelijkt geobserveerde met verwachte aantallen

Waarom chi-kwadraattoetsen in enquêtes gebruiken
Voer invoervariabelen in die relevant zijn voor de uitkomstvariabele
Begrijp de impact van variabelen op de populatie
Check of verschillen toeval zijn of statistisch significant

1 Photo by Firmbee.com on Unsplash
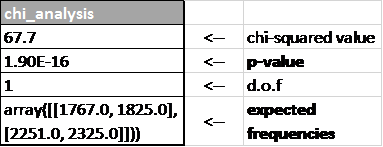
Resultaat en interpretatie van pet_survey