Python voor MATLAB-gebruikers
Justin Kiggins
Product Manager
print(arr)
[[2, 4, 8, 16, 32]]
print(arr[2])
8
print(arr[0])
2
print(arr[-1])
32
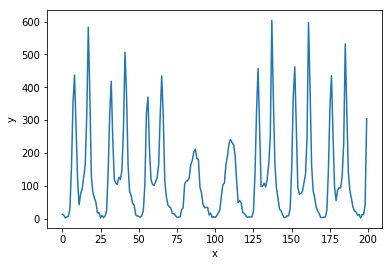
import matplotlib.pyplot as plt
# Maak een nieuwe figuur
plt.figure()

# Plot y als functie van x
plt.plot(x, y)

# Zet het x- en y-label
plt.xlabel('x')
plt.ylabel('y')

# Vergeet de plot niet te tonen!
plt.show()
# Maak een nieuwe figuur plt.figure()
# Plot y als functie van x plt.plot(x, y)
# Zet het x- en y-label plt.xlabel('x') plt.ylabel('y')
# Vergeet de plot niet te tonen! plt.show()