Multivariate gegevens plotten
Multivariate kansverdelingen in R

Surajit Ray
Professor, University of Glasgow
Basis R-plot voor multivariate data
pairs(iris_raw[, 1:4])
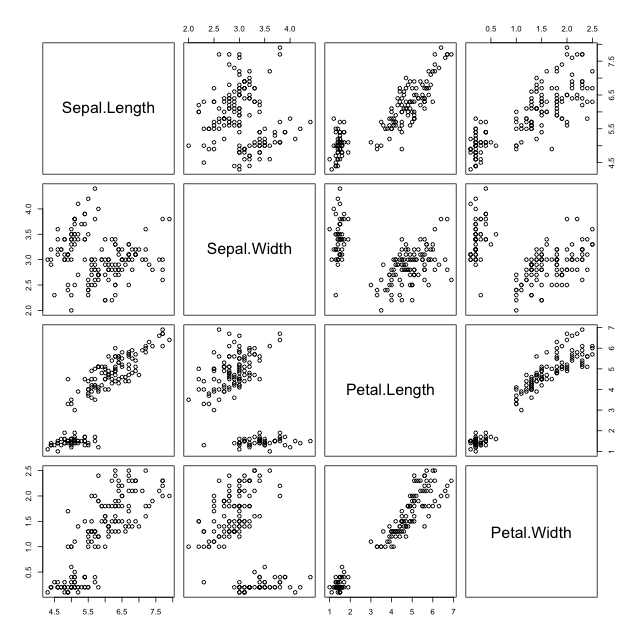
- Minder bruikbaar met veel variabelen
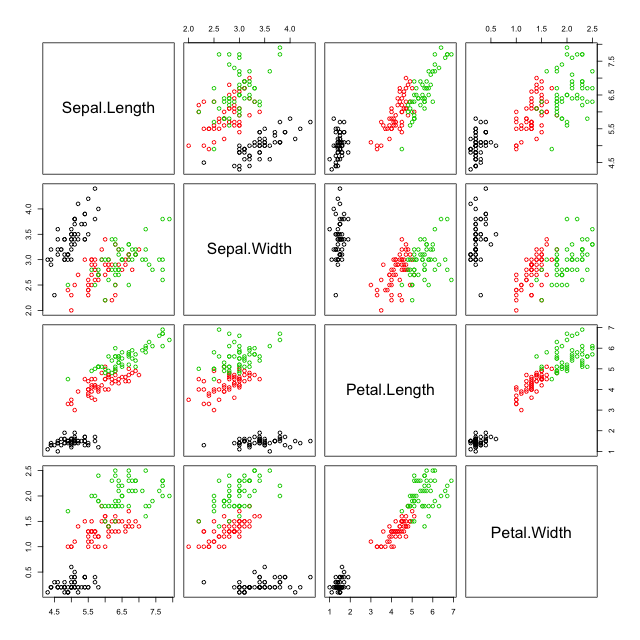
Pairs-plot met kleur
pairs(iris_raw[, 1:4], col = iris_raw$Species)
Lattice
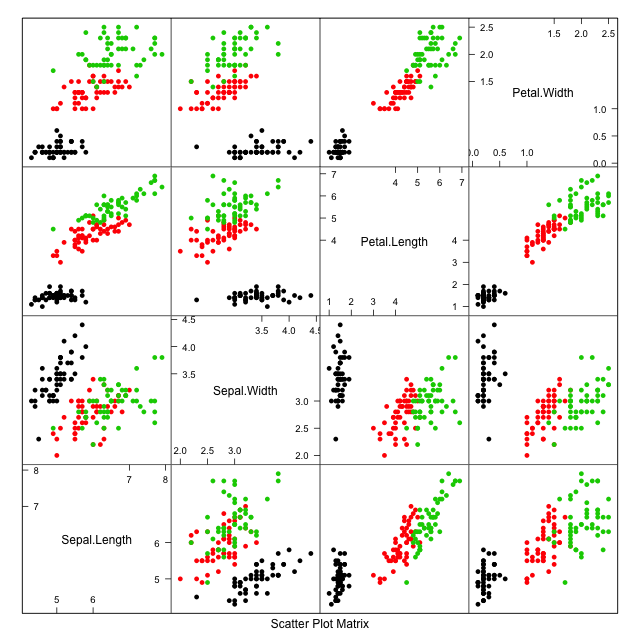
library(lattice)
splom(~iris_raw[, 1:4], col = iris_raw$Species, pch = 16)
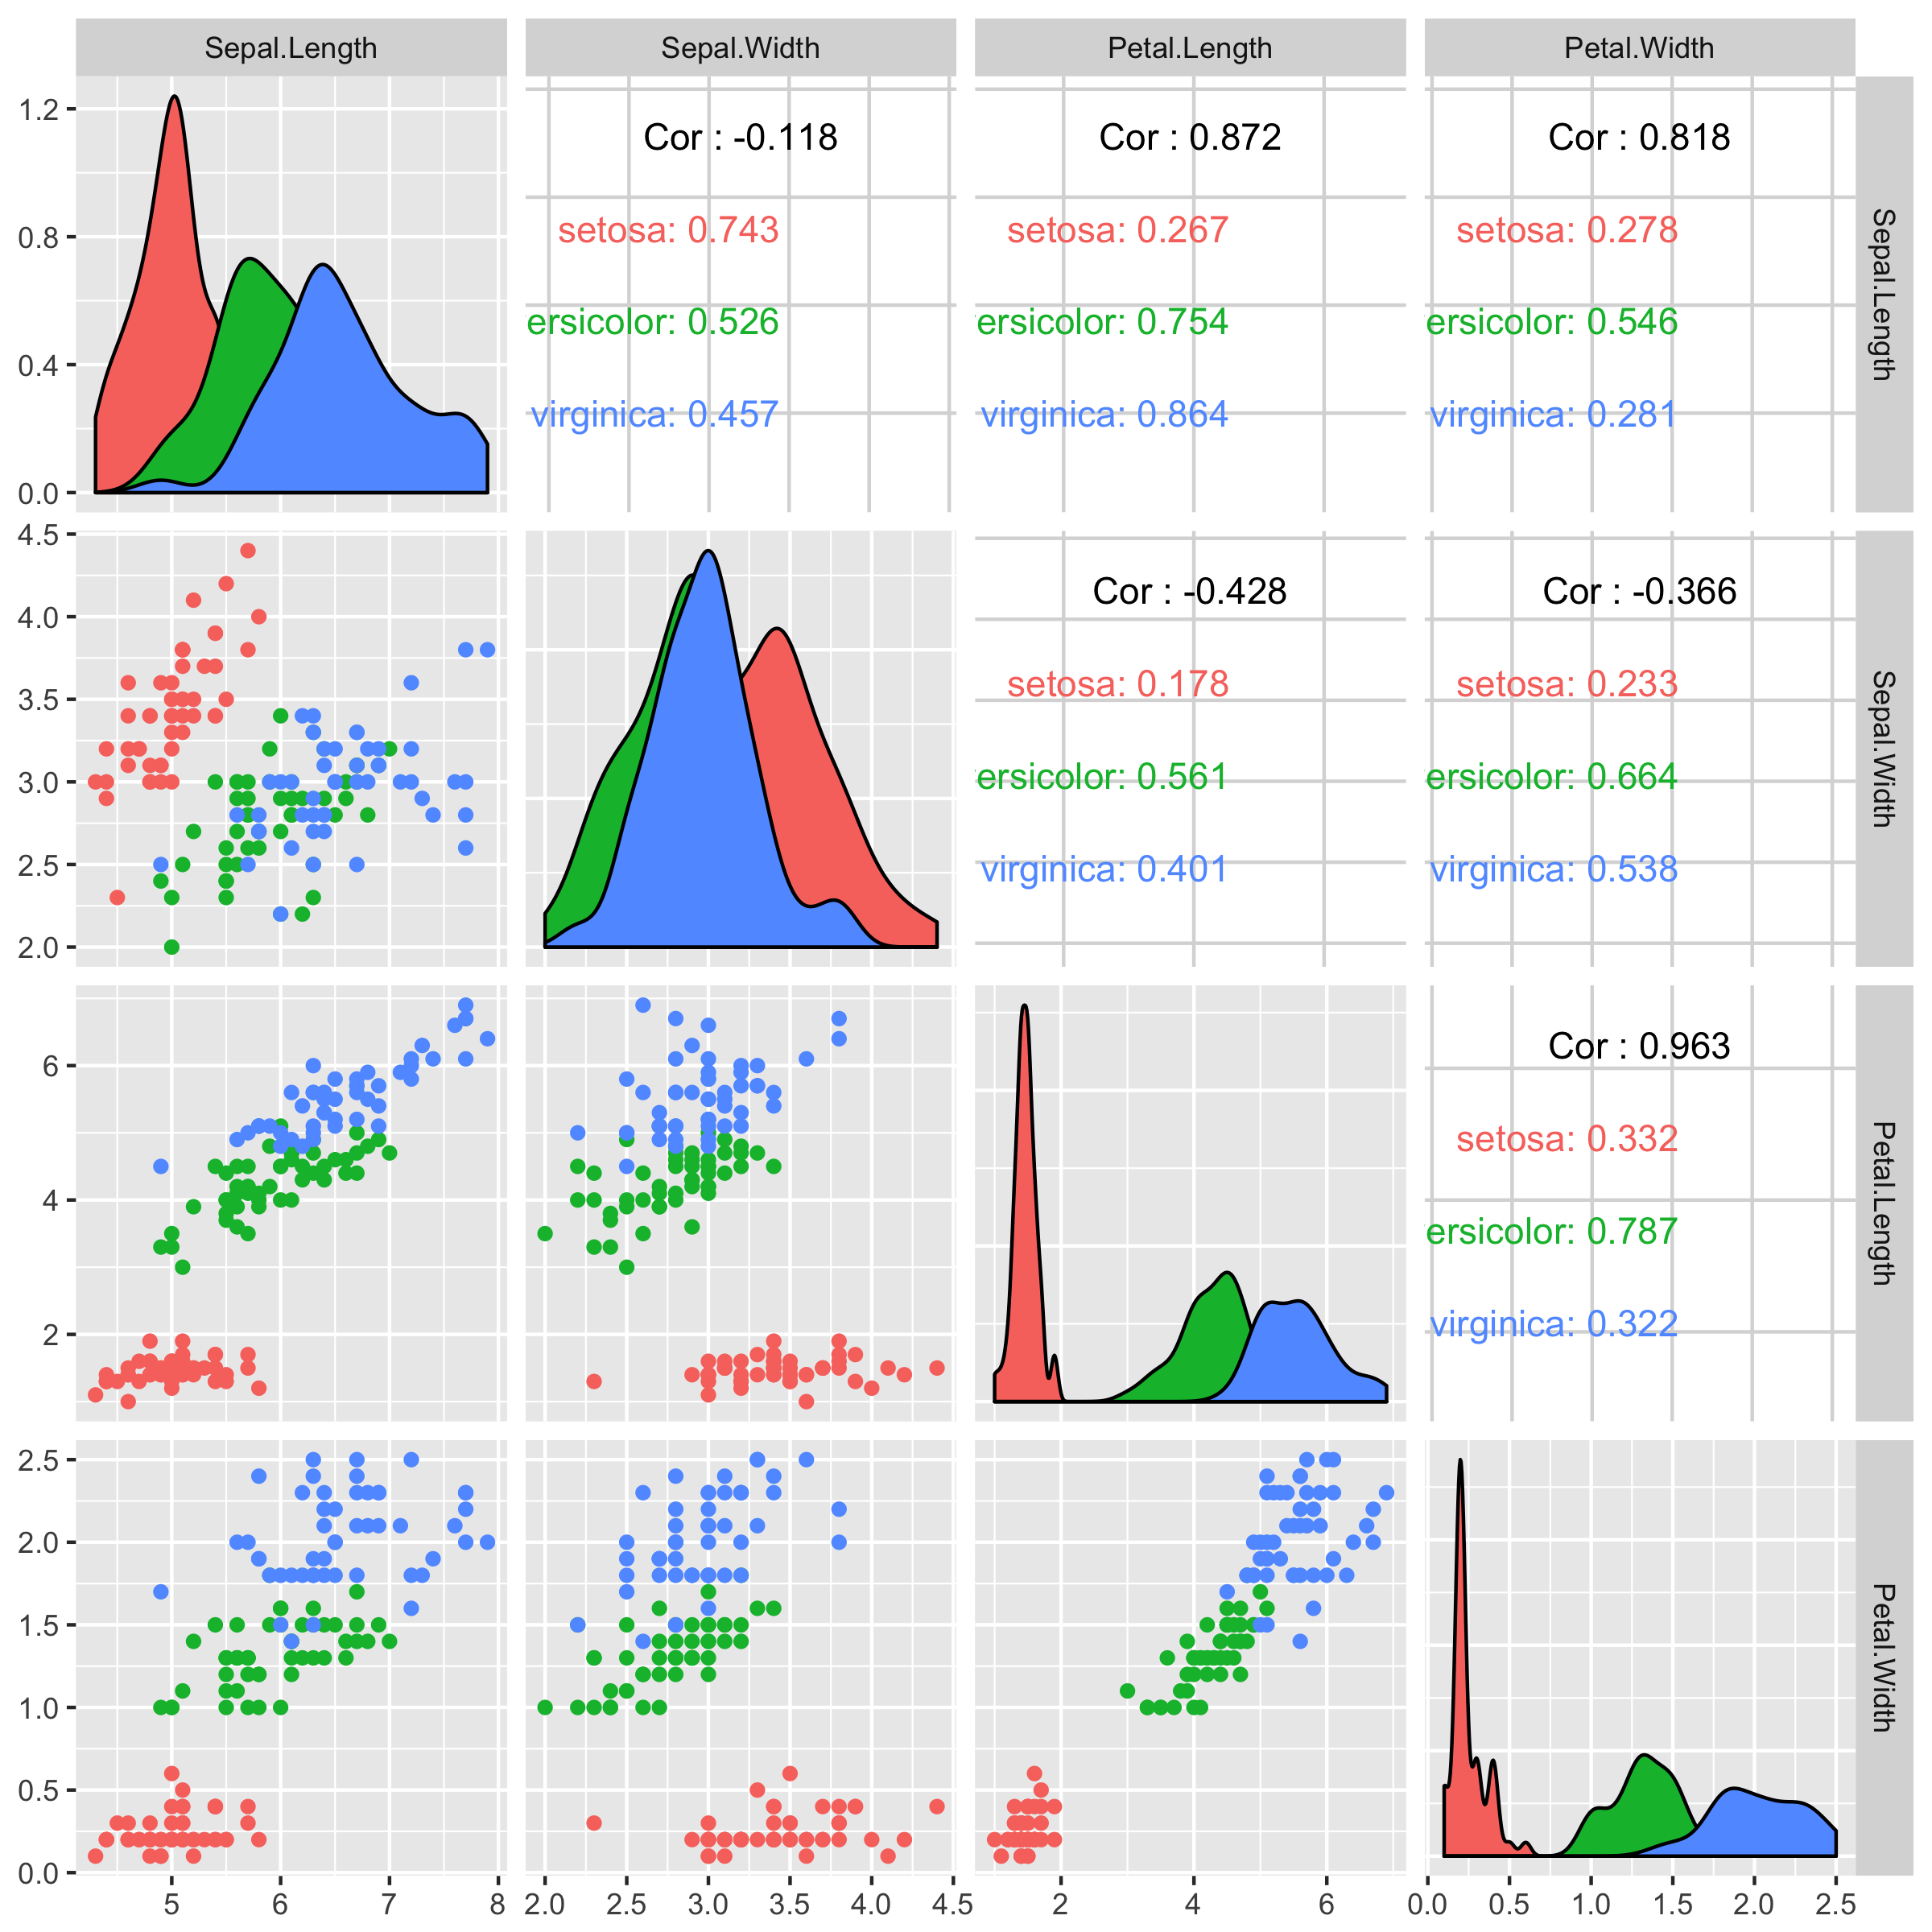
Met ggplot
library(ggplot2)
library(GGally)
ggpairs(data = iris_raw, columns = 1:4, mapping = aes(color = Species))
3D-plots
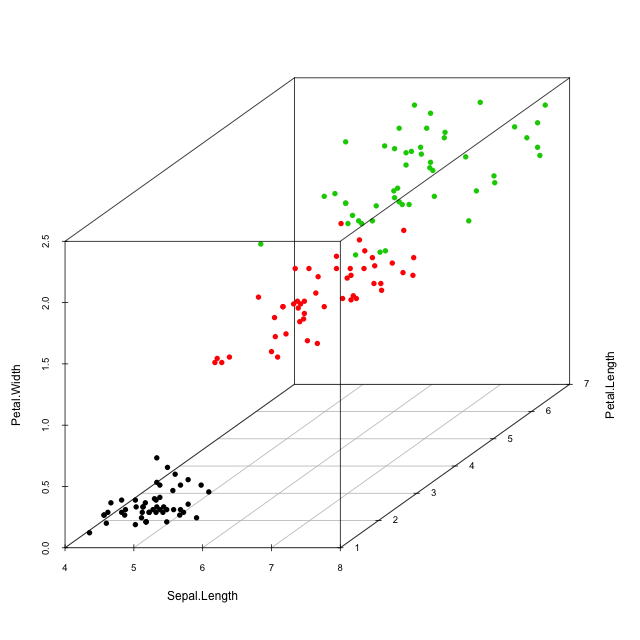
library(scatterplot3d)
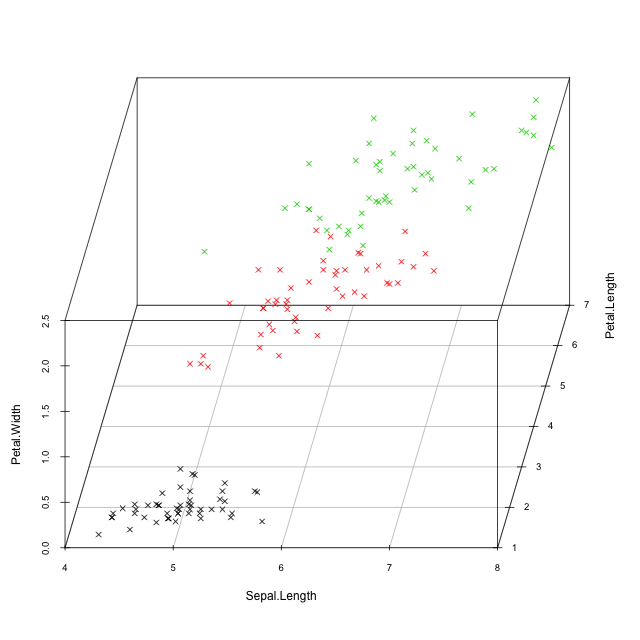
scatterplot3d(iris_raw[, c(1, 3, 4)], color = as.numeric(iris_raw$Species))
3D-plots
scatterplot3d(iris_raw[, c(1, 3, 4)], color = as.numeric(iris_raw$Species),pch = 4, angle = 80)