Selectiestrategieën
Gemiddeld gevorderde interactieve datavisualisatie met plotly in R

Adam Loy
Statistician, Carleton College
Twee selectiestrategieën
Voorbeeld
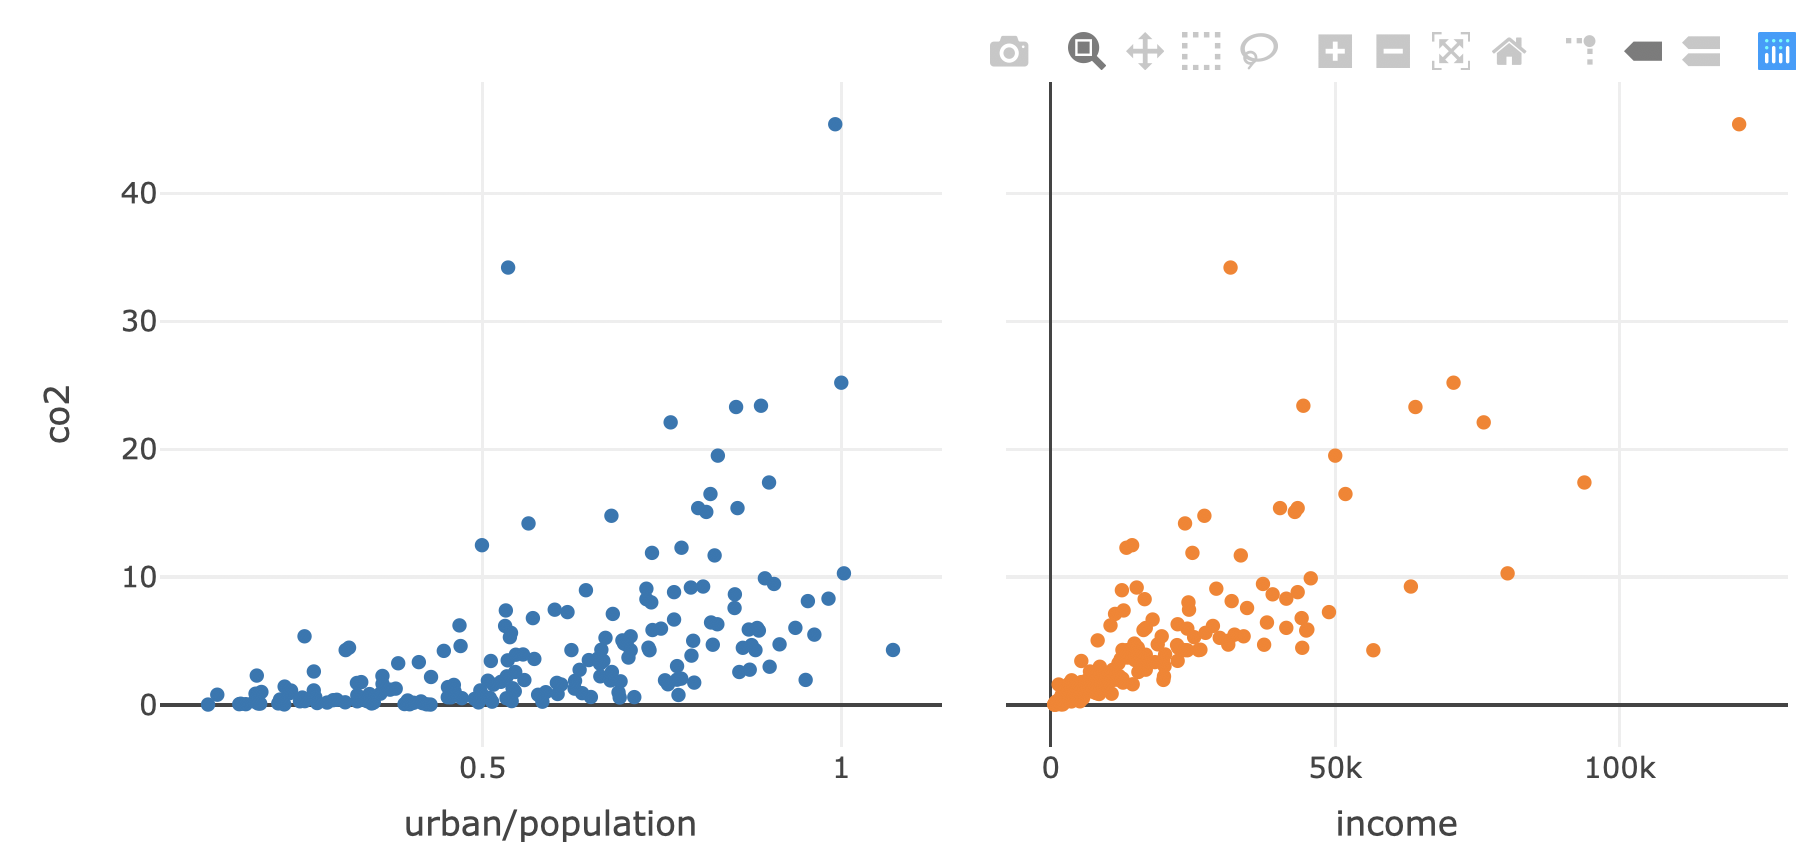
Blijvende selectie
Schakel blijvende selectie in met highlight()
subplot(p1, p2, titleX = TRUE, shareY = TRUE) %>%
  hide_legend() %>%
  highlight(persistent = TRUE)
Markeren in kleur
Twee manipulatiesoorten