Je strategie visualiseren
Financieel traden in R

Ilya Kipnis
Professional Quantitative Analyst and R programmer
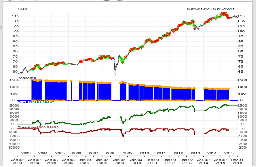
Hoe het eruitziet
Ingezoomd
- Gebruik
zoom_Chart("date1/date2")voor een close-up zoom_Chart("2007-08/2007-12")geeft:
Financieel traden in R
Ilya Kipnis
Professional Quantitative Analyst and R programmer
zoom_Chart("date1/date2") voor een close-upzoom_Chart("2007-08/2007-12") geeft:

