Cartografische workflows met tigris en tidycensus

US Census-gegevens analyseren in R

Kyle Walker

Instructor
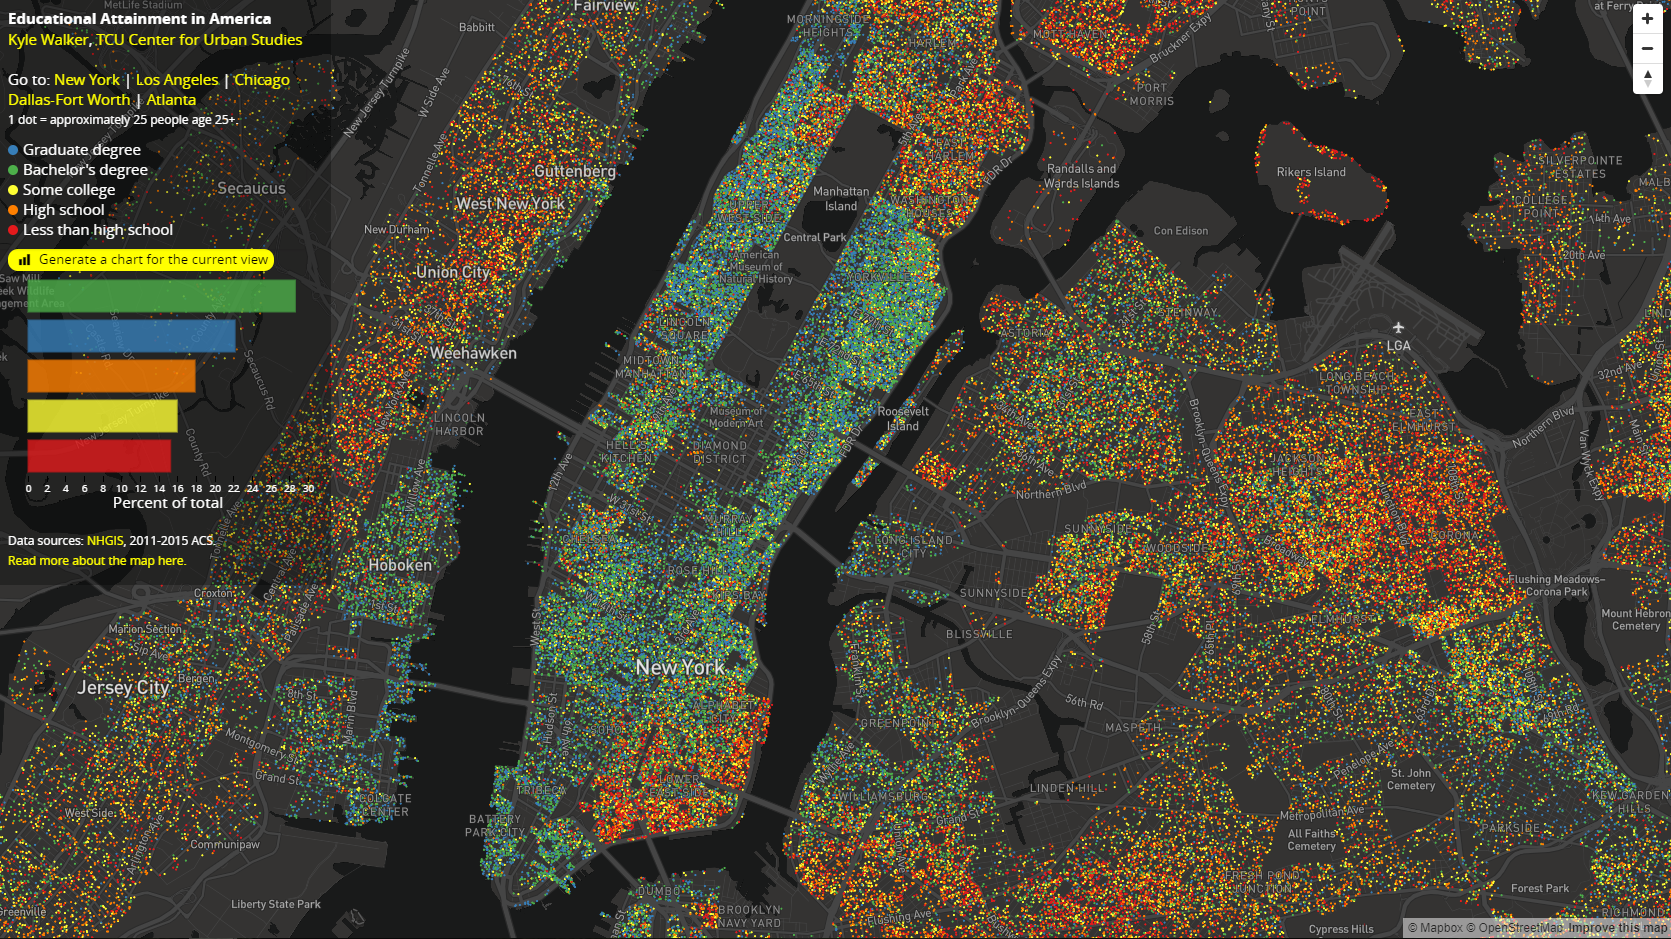
Kaart met stippen voor opleiding

US Census-gegevens analyseren in R

Willekeurige stippen genereren met sf

Belangrijke functie voor willekeurige puntgeneratie in sf: st_sample()

dc_dots <- map(c("White", "Black", "Hispanic", "Asian"), function(group) {
  dc_race %>%
    filter(variable == group) %>%
    st_sample(., size = .$value / 100) %>%
    st_sf() %>%
    mutate(group = group) 
}) %>%
  reduce(rbind)
US Census-gegevens analyseren in R

Aandachtspunten bij willekeurige stippen

Voor sneller plotten:

dc_dots <- dc_dots %>%
  group_by(group) %>%
  summarize()

Voor nauwkeurigere visualisaties:

dc_dots_shuffle <- sample_frac(dc_dots, size = 1)
US Census-gegevens analyseren in R

Basis dot-density-mapping met sf

plot(dc_dots_shuffle, key.pos = 1)
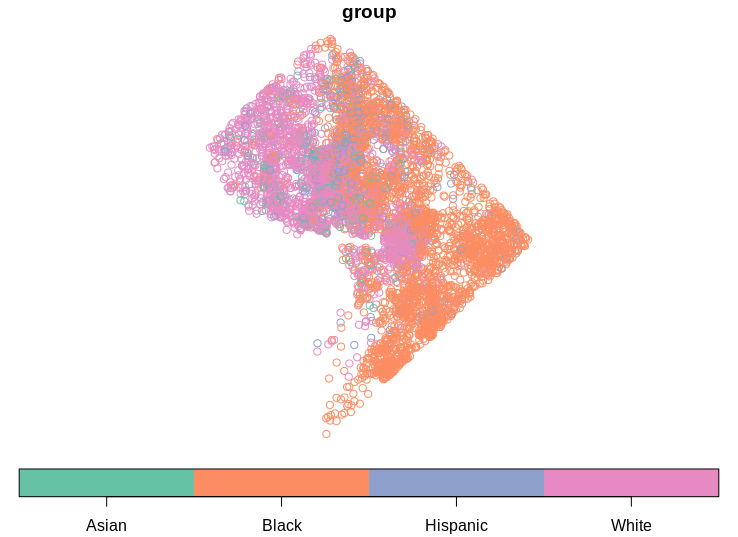
Eenvoudige dot-density-kaart

US Census-gegevens analyseren in R

Hulplagen met tigris

options(tigris_class = "sf")

dc_roads <- roads("DC", "District of Columbia") %>%
  filter(RTTYP %in% c("I", "S", "U"))

dc_water <- area_water("DC", "District of Columbia")
dc_boundary <- counties("DC", cb = TRUE)
US Census-gegevens analyseren in R

Hulplagen met tigris

plot(dc_water$geometry, col = "lightblue")
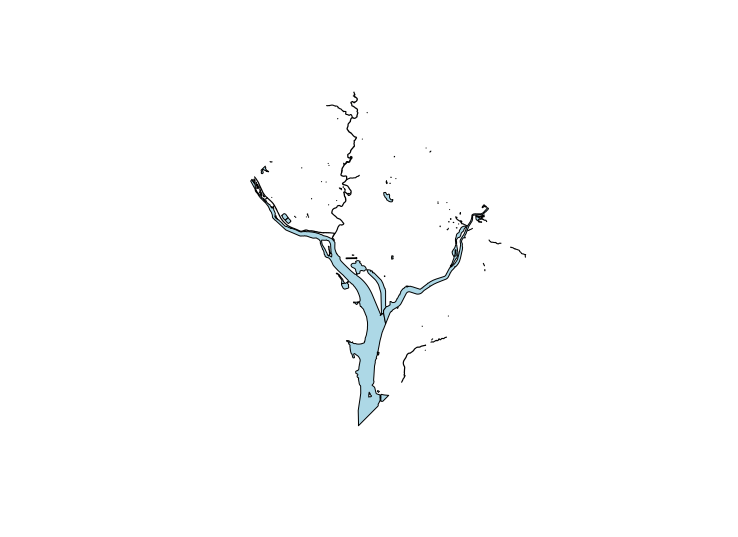
Plot van water in DC

US Census-gegevens analyseren in R

Dot-density-mapping met ggplot2

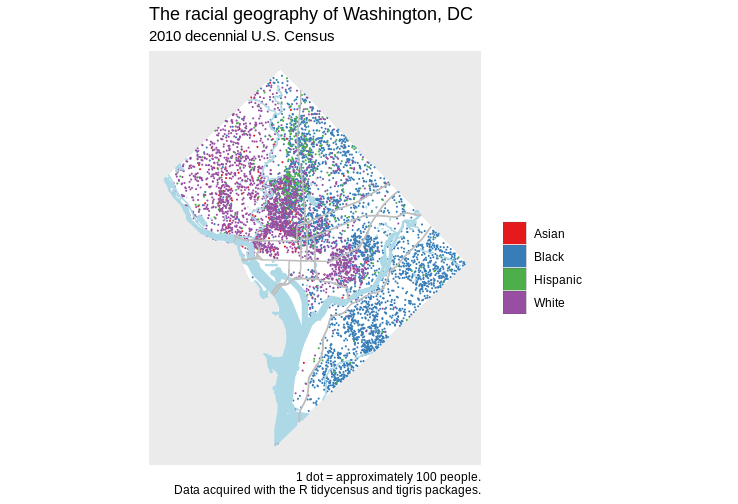
ggplot() + 
  geom_sf(data = dc_boundary, color = NA, fill = "white") + 
  geom_sf(data = dc_dots, aes(color = group, fill = group), size = 0.1) + 
  geom_sf(data = dc_water, color = "lightblue", fill = "lightblue") + 
  geom_sf(data = dc_roads, color = "grey") + 
  coord_sf(crs = 26918, datum = NA) + 
  scale_color_brewer(palette = "Set1", guide = FALSE) +
  scale_fill_brewer(palette = "Set1") +
  labs(title = "The racial geography of Washington, DC", 
       subtitle = "2010 decennial U.S. Census", 
       fill = "", 
       caption = "1 dot = approximately 100 people.\nData acquired with 
                  the R tidycensus and tigris packages.")
US Census-gegevens analyseren in R

Definitieve dot-density-kaart

US Census-gegevens analyseren in R

Aandachtspunten bij dot-density-kaarten

  • Let op hoe dot-density-kaarten kunnen worden misbegrepen
  • Kies kwalitatieve kleuren zorgvuldig
  • Wees kritisch bij het kiezen van hulplagen
US Census-gegevens analyseren in R

Laten we oefenen!

US Census-gegevens analyseren in R

Preparing Video For Download...