Data plotten met tigris en ggplot2

US Census-gegevens analyseren in R

Kyle Walker

Instructor

Ruimtelijke data plotten met geom_sf()

ggplot(tx_joined) + 
  geom_sf()
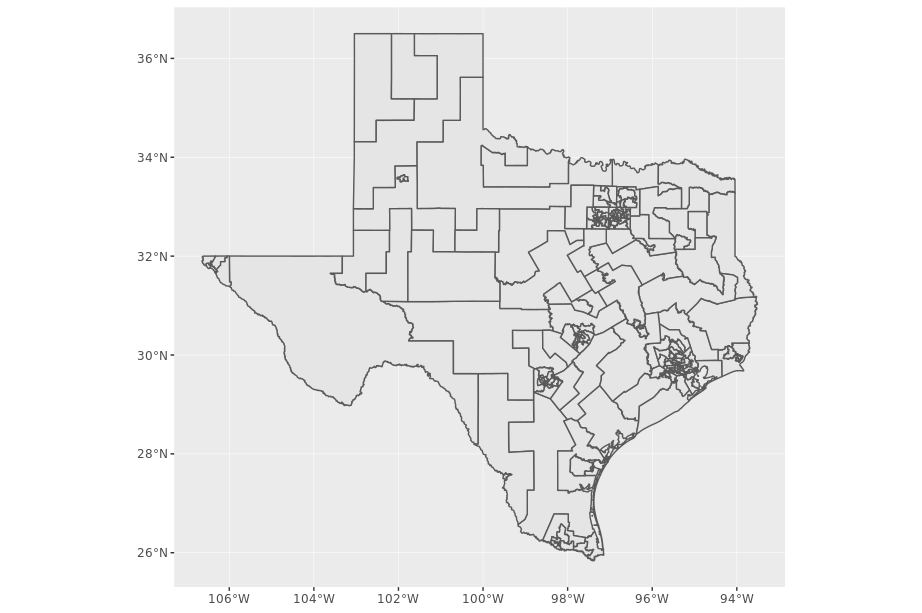
plot met geom_sf

US Census-gegevens analyseren in R

De fill-esthetiek voor regio's instellen

ggplot(tx_joined, aes(fill = Party)) + 
  geom_sf()
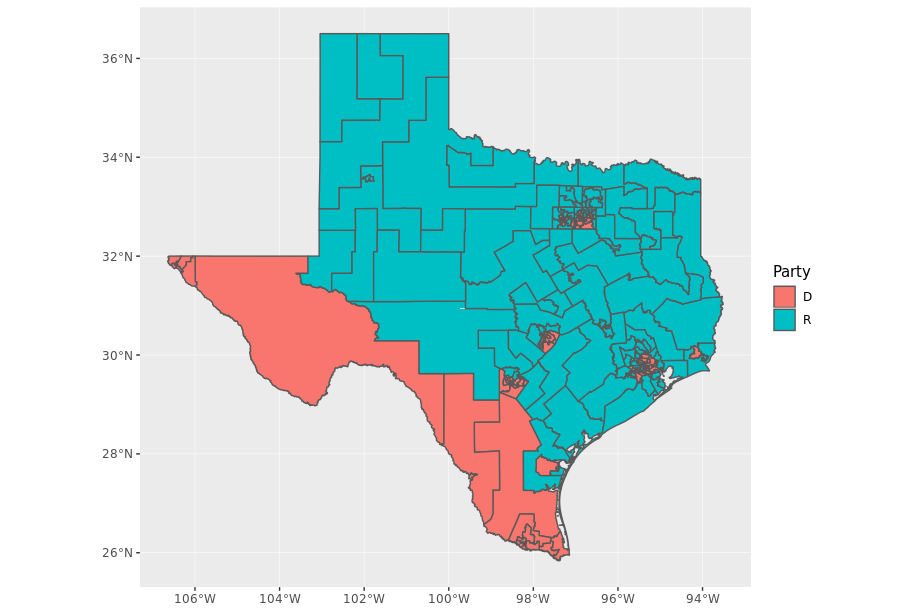
gevuld plot met geom_sf

US Census-gegevens analyseren in R

Fill-kleuren aanpassen

ggplot(tx_joined, aes(fill = Party)) + 
  geom_sf() + 
  scale_fill_manual(values = c("R" = "red", "D" = "blue"))
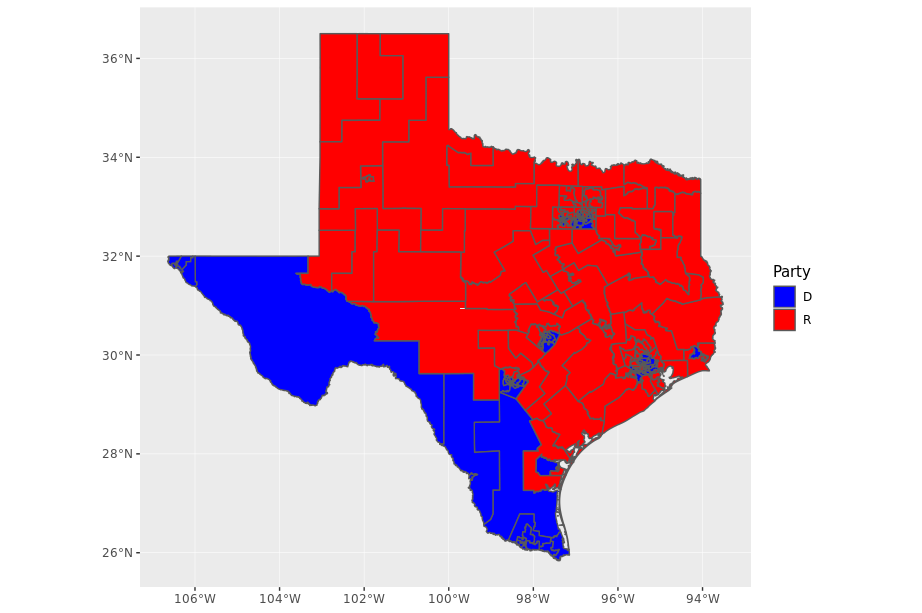
juiste kleuren met geom_sf

US Census-gegevens analyseren in R

De output finetunen

ggplot(tx_joined, aes(fill = Party)) + 
  geom_sf() + 
  coord_sf(crs = 3083, datum = NA) + 
  scale_fill_manual(values = c("R" = "red", "D" = "blue")) + 
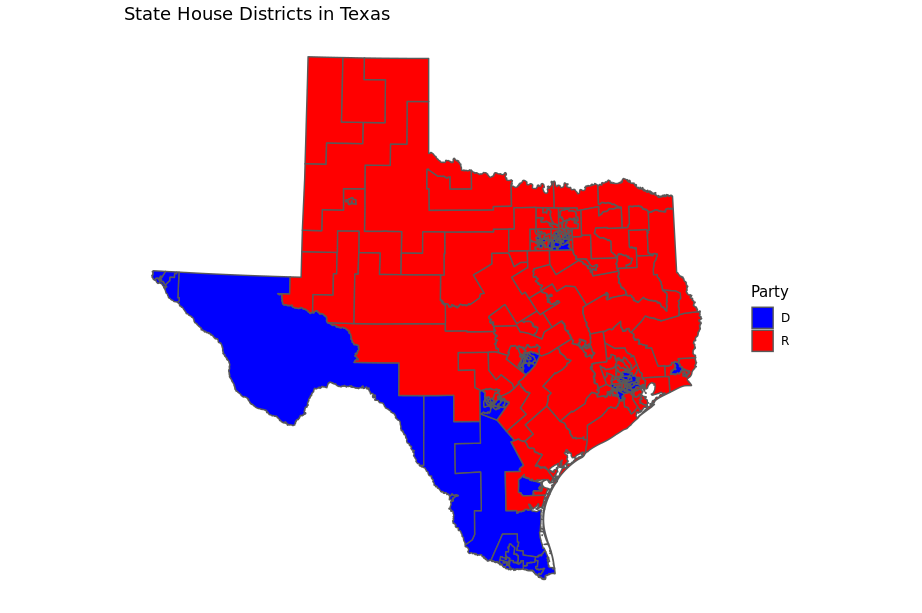
  theme_minimal() + 
  labs(title = "State House Districts in Texas")
US Census-gegevens analyseren in R

Gepolijst ruimtelijk plot

US Census-gegevens analyseren in R

Laten we oefenen!

US Census-gegevens analyseren in R

Preparing Video For Download...