De snelkoppeling via benadering
Inferentie voor categorische gegevens in R

Andrew Bray
Assistant Professor of Statistics at Reed College
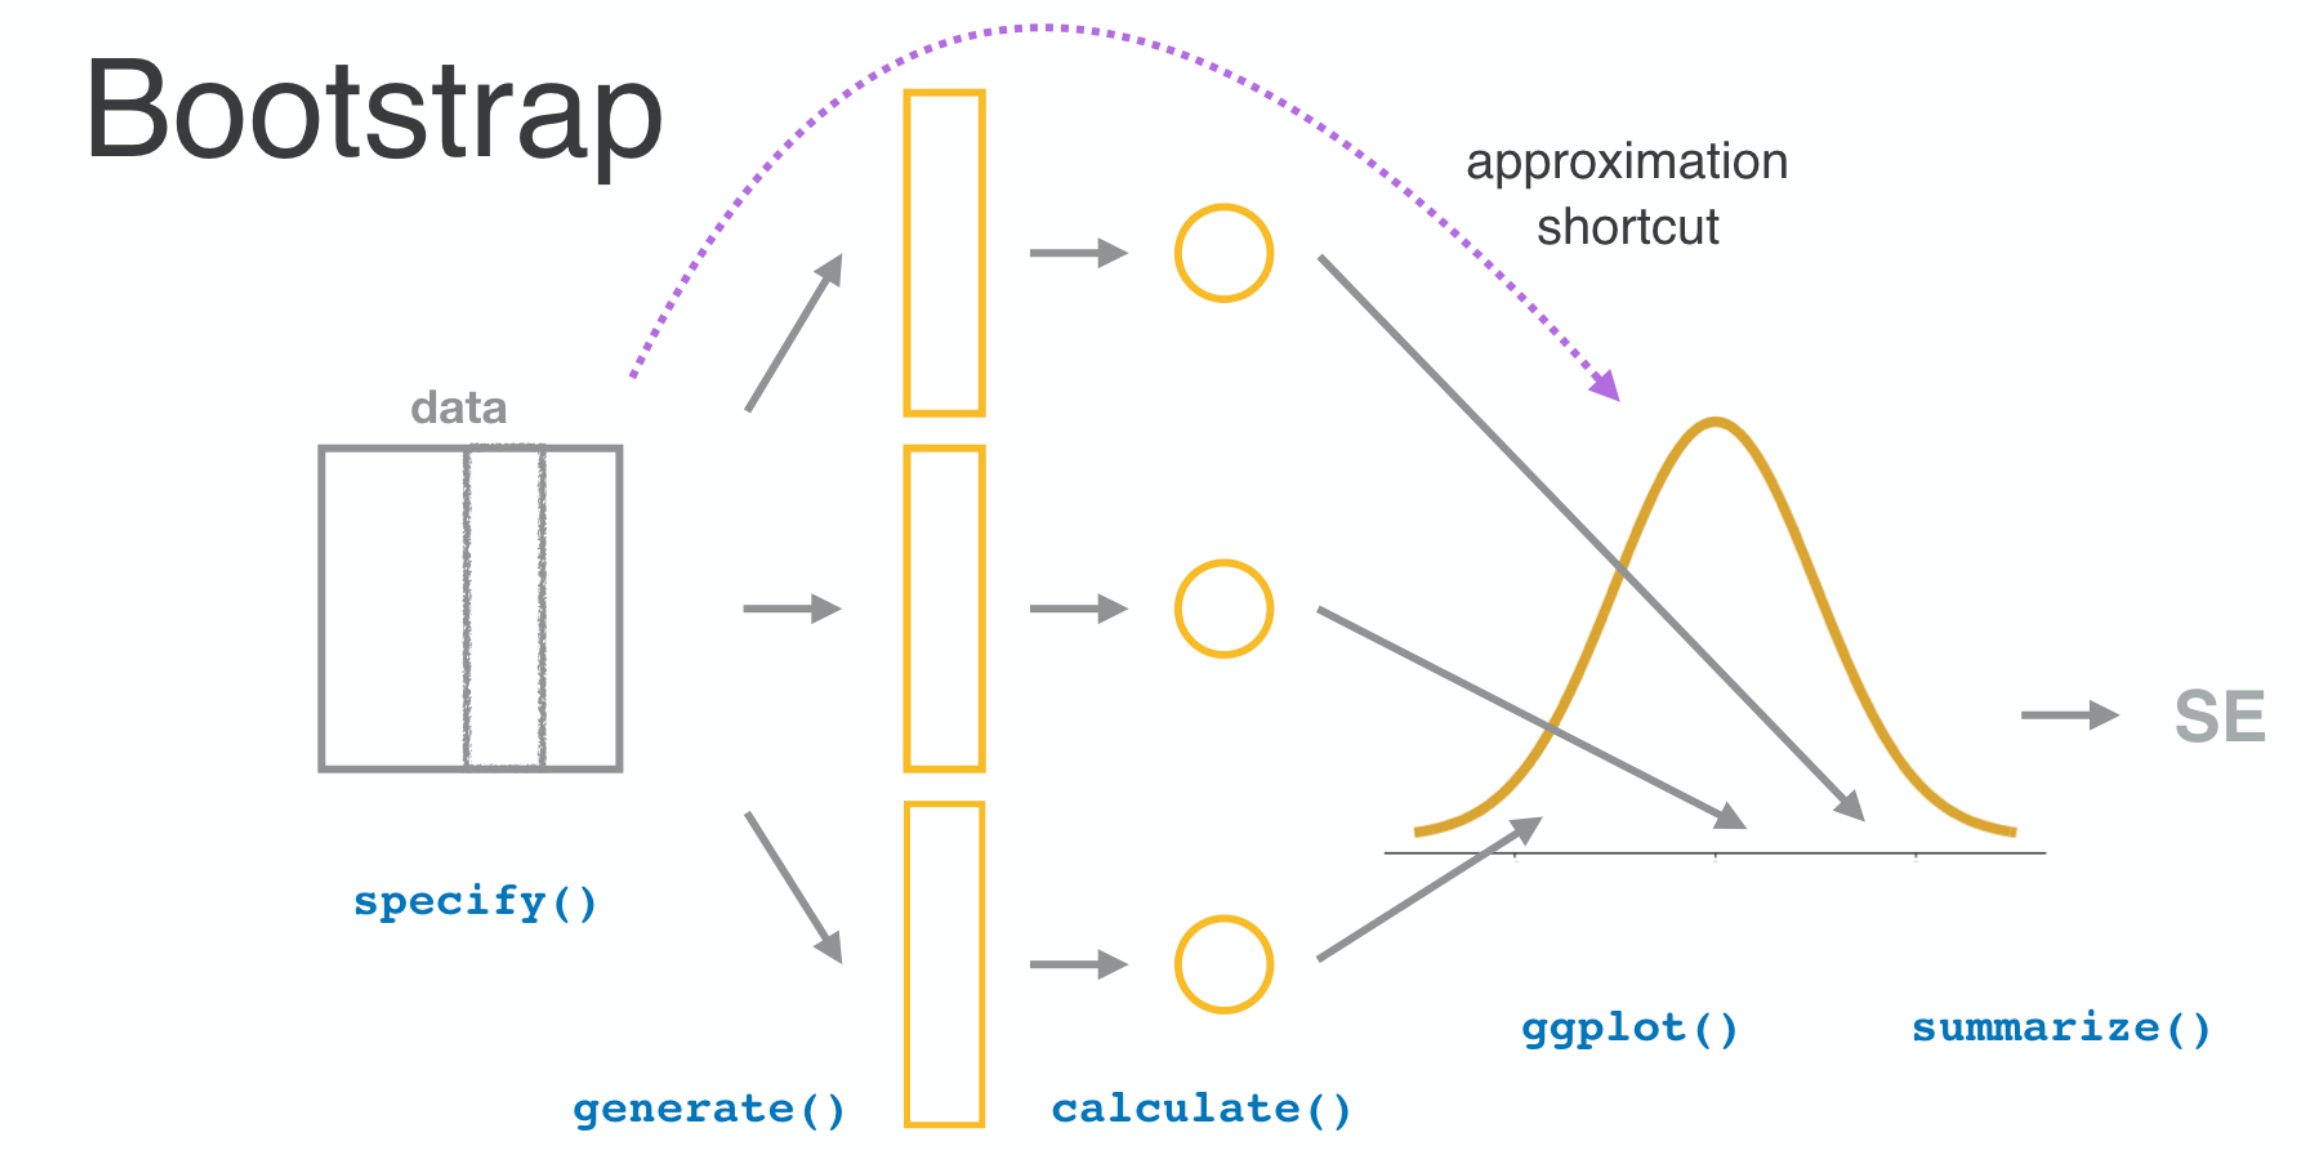
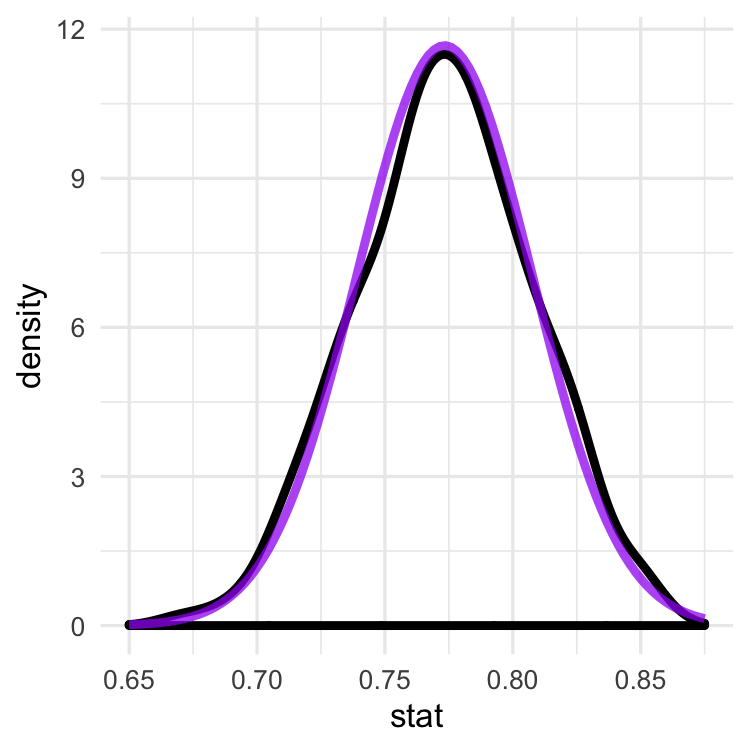
De normale verdeling
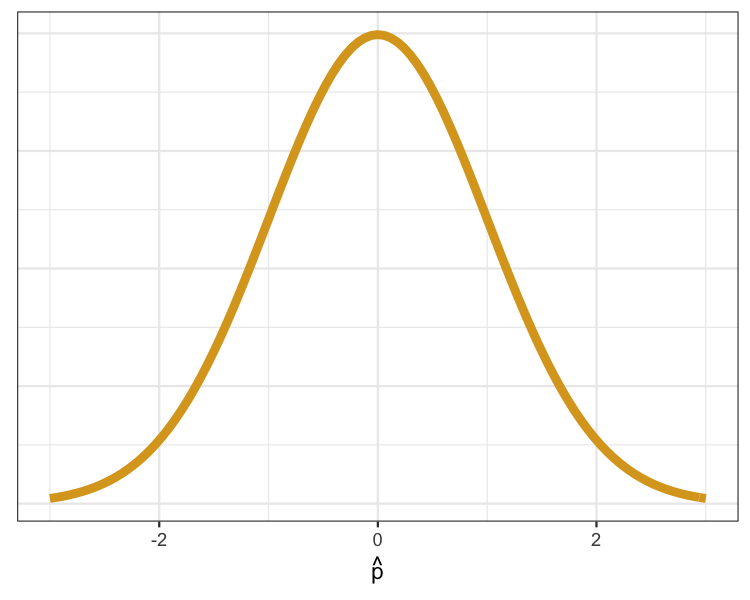
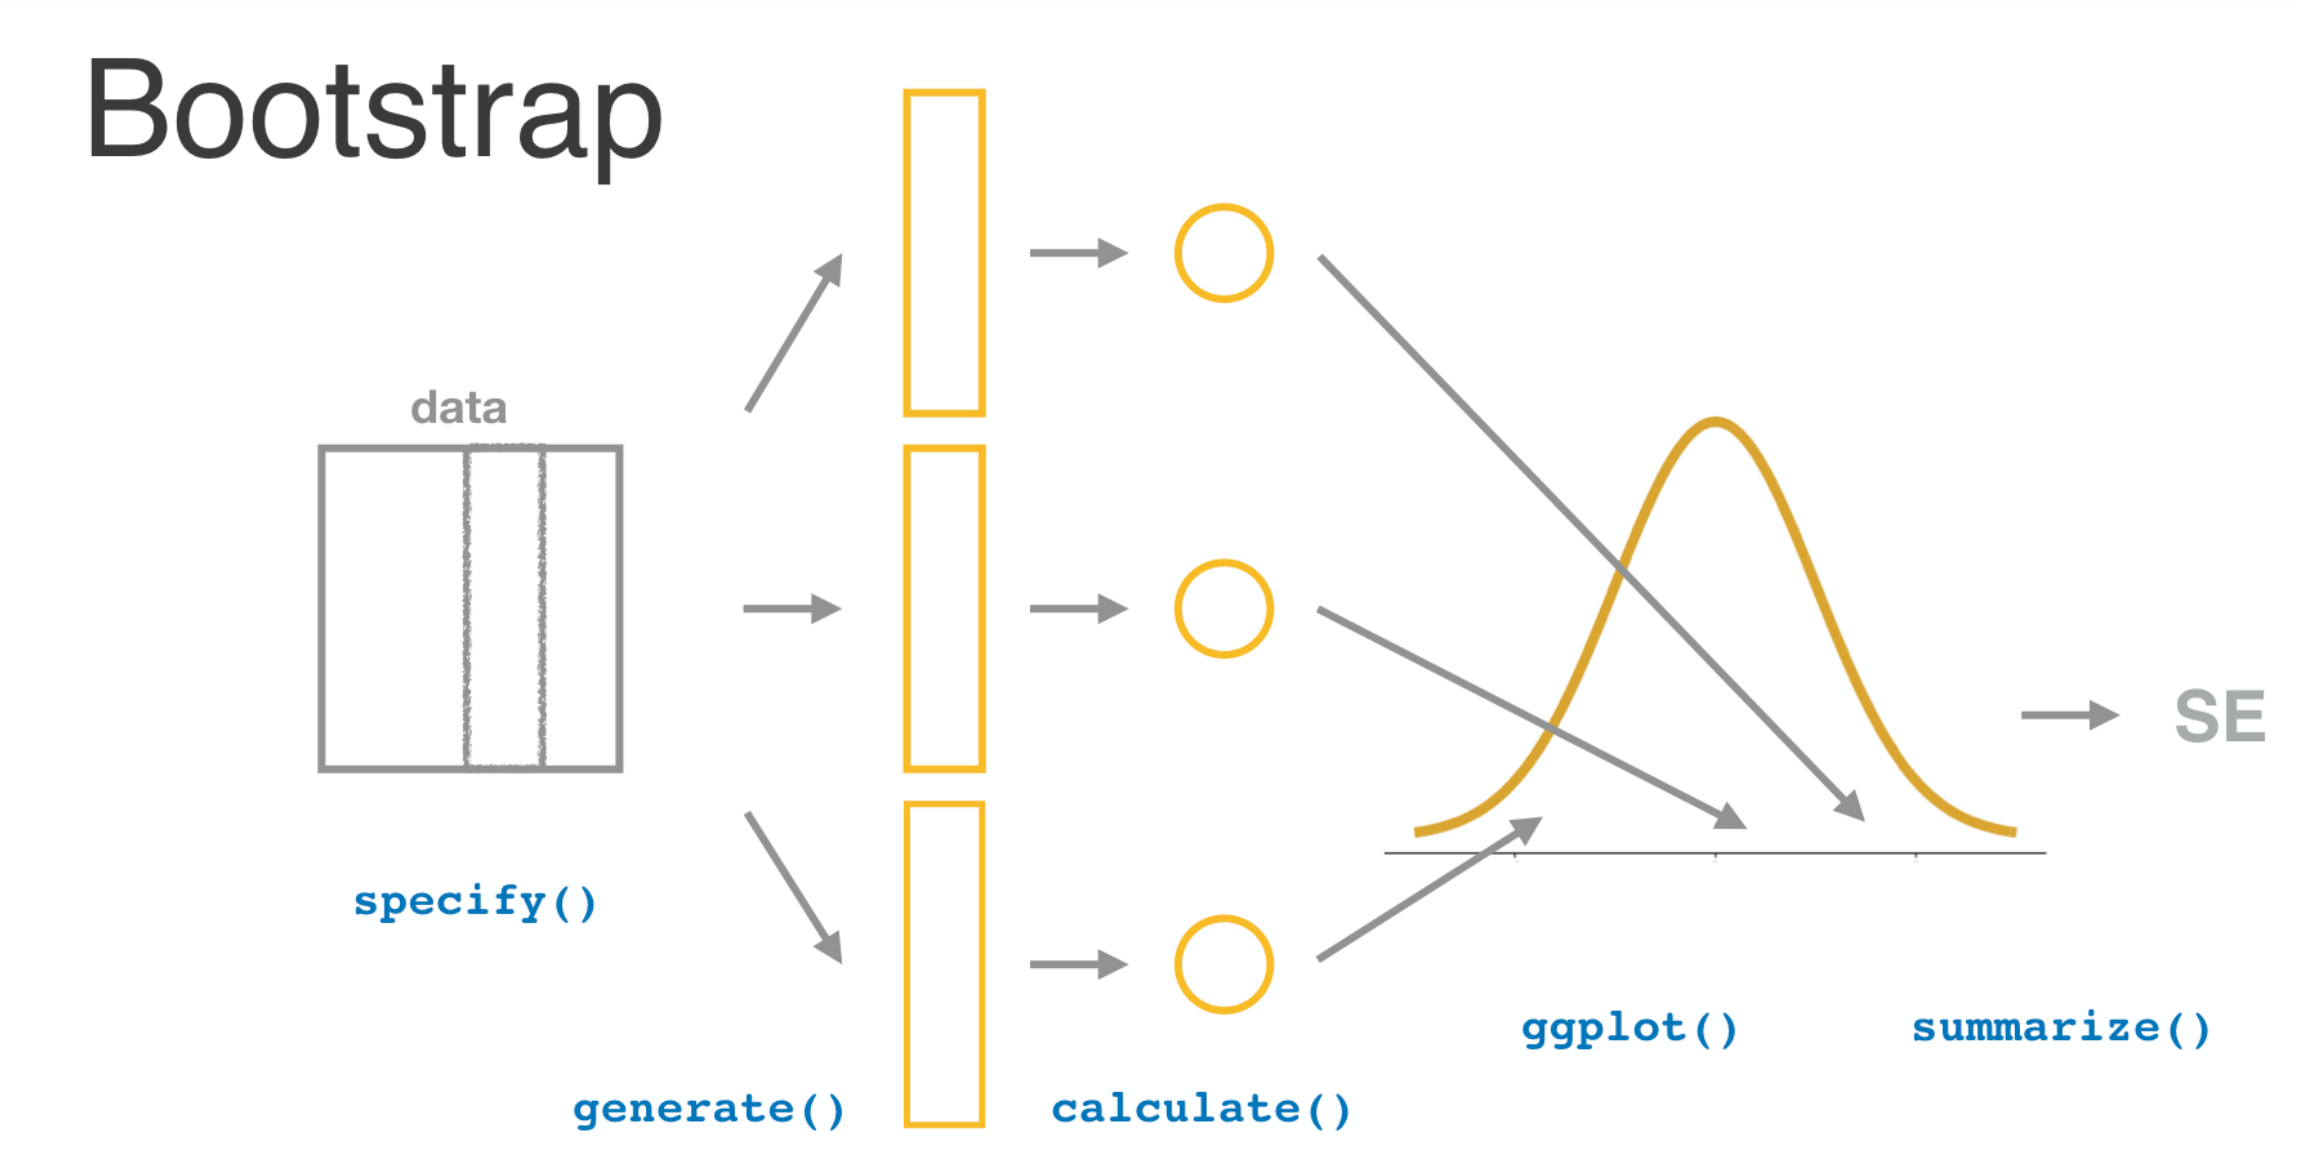
Steekproevenverdelinge n
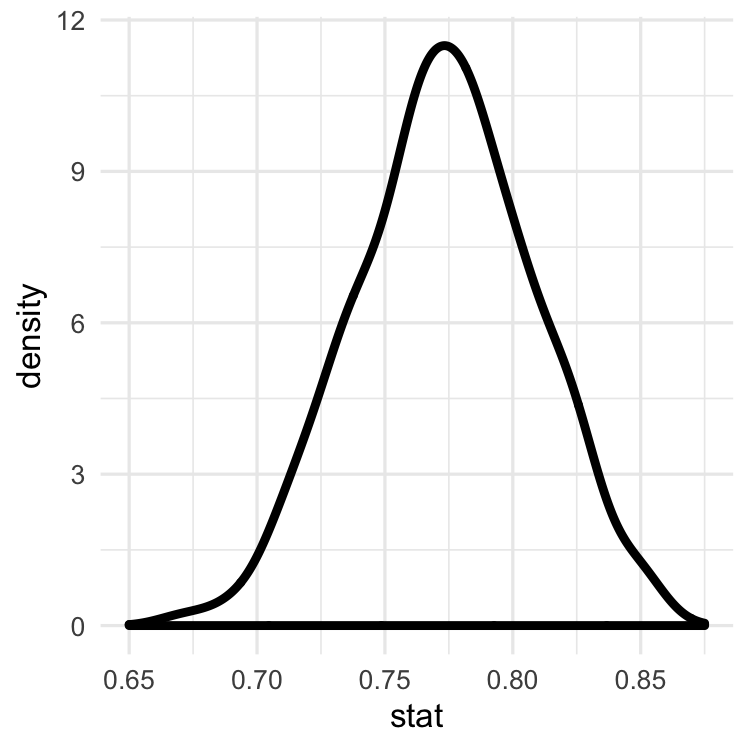
Steekproevenverdelingen
Steekproevenverdelingen
Inferentie voor categorische gegevens in R
Andrew Bray
Assistant Professor of Statistics at Reed College

