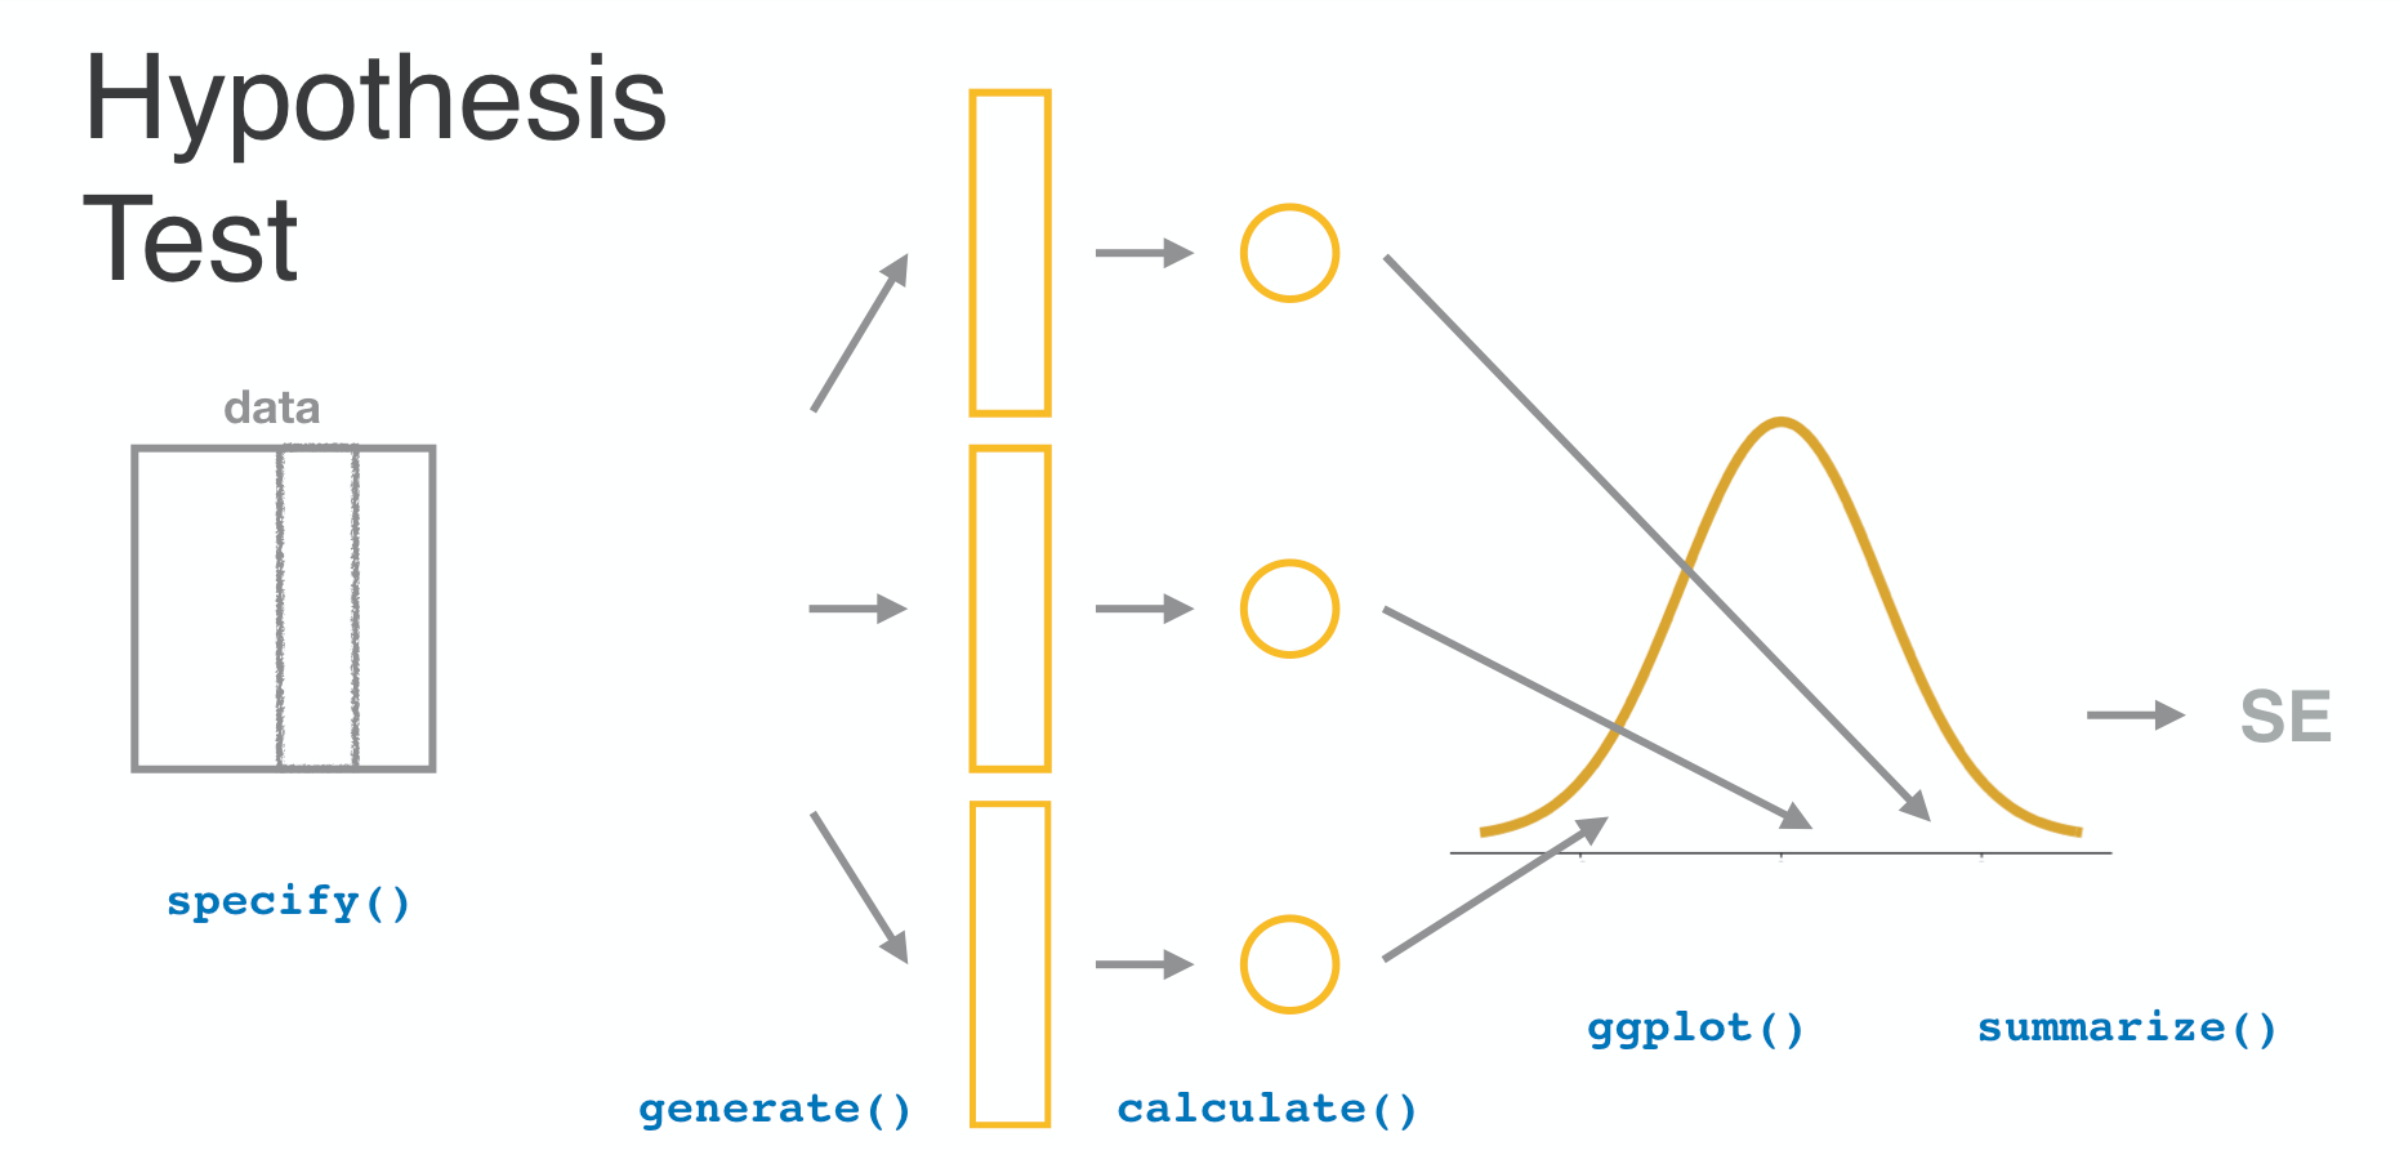
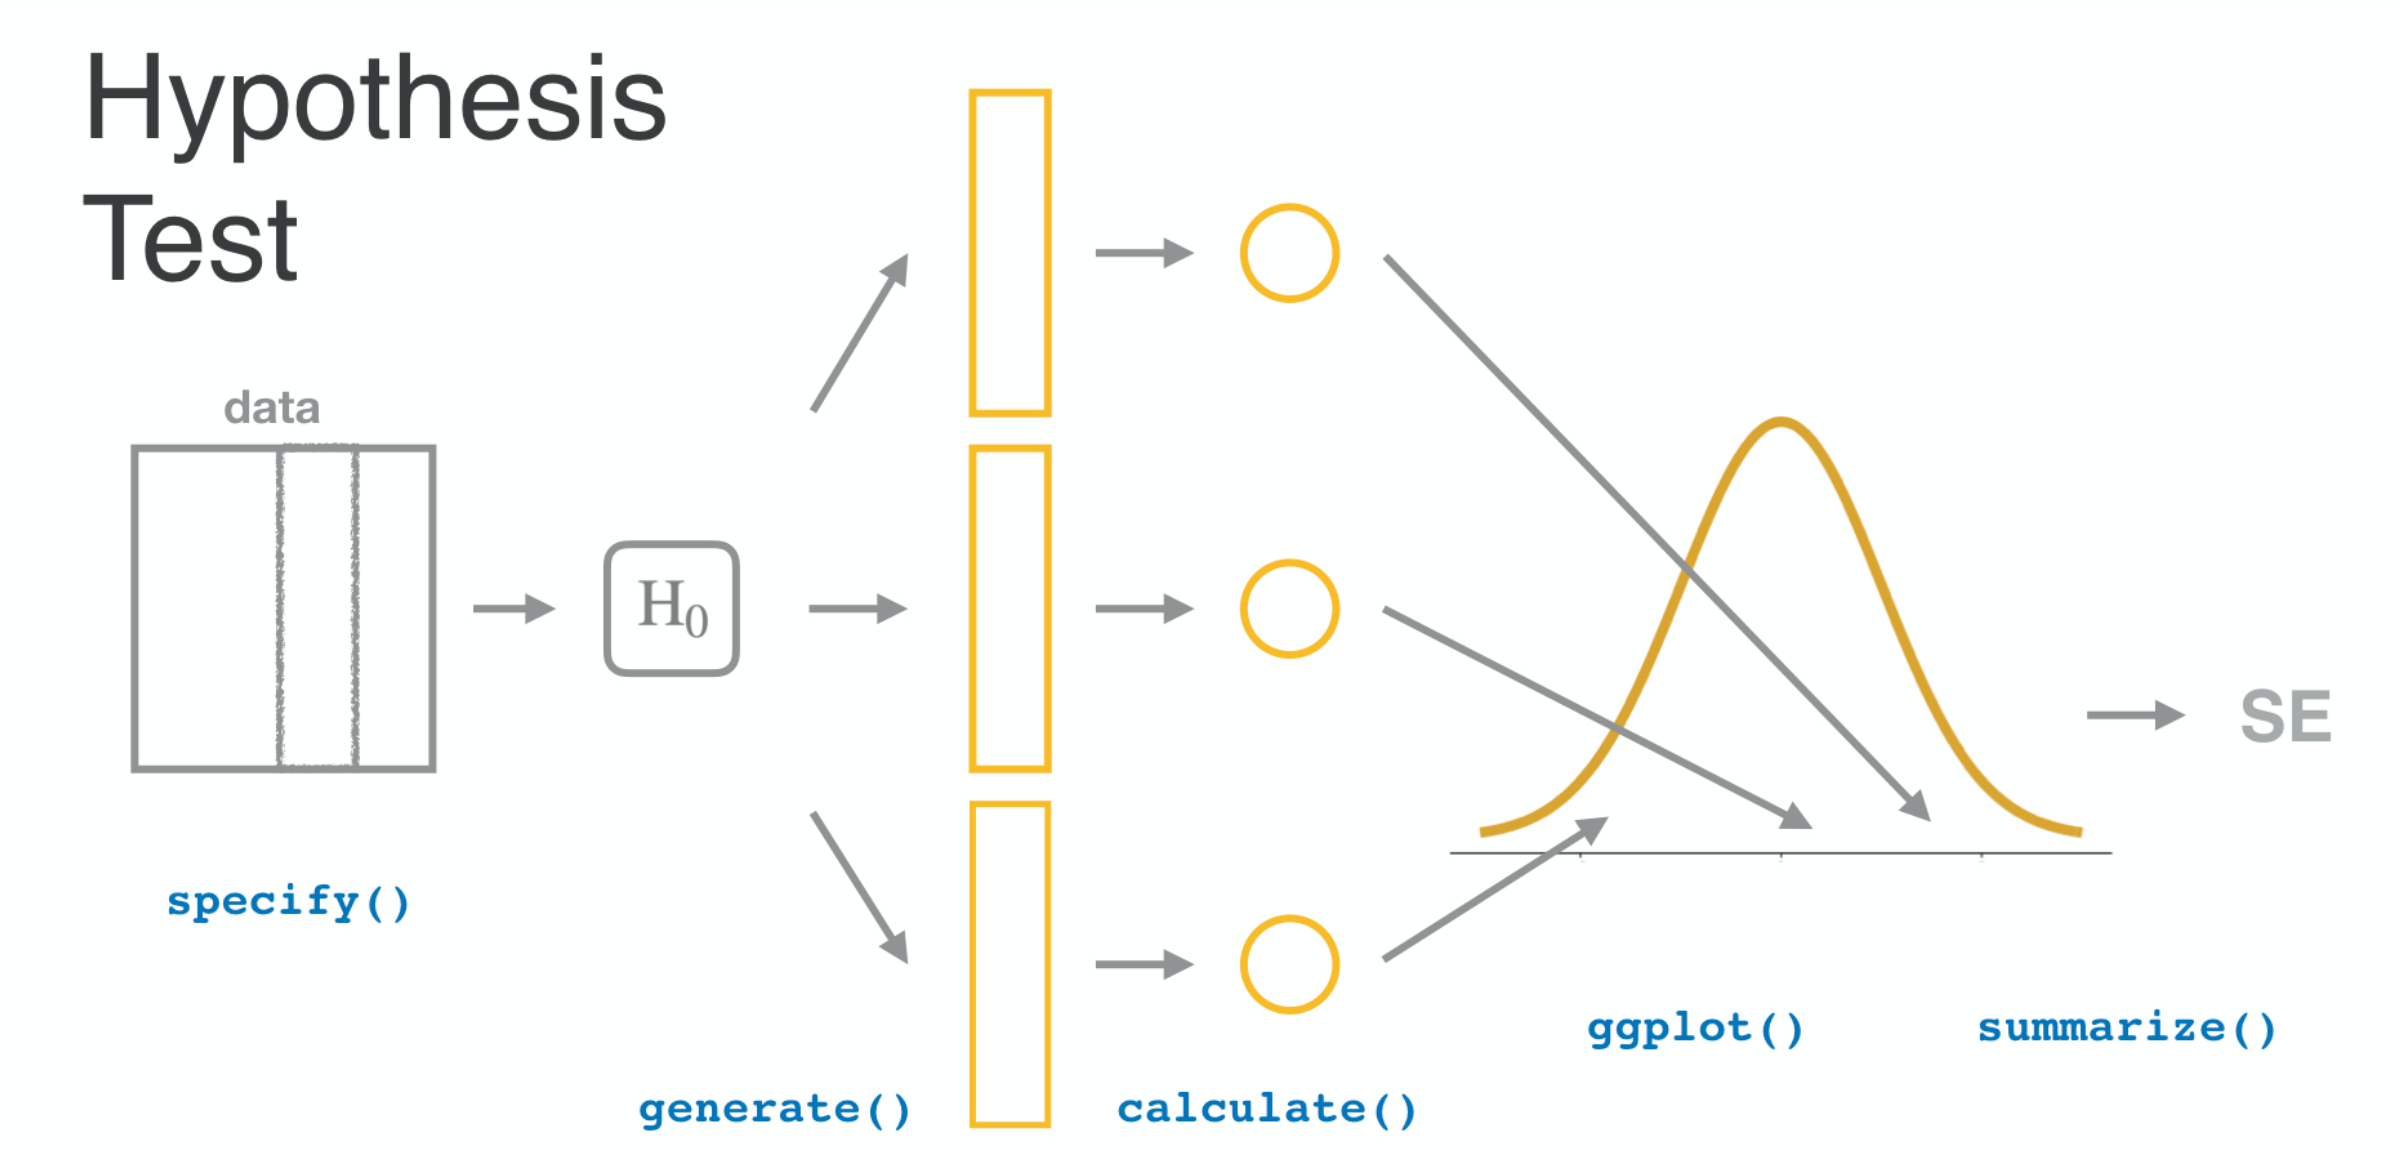
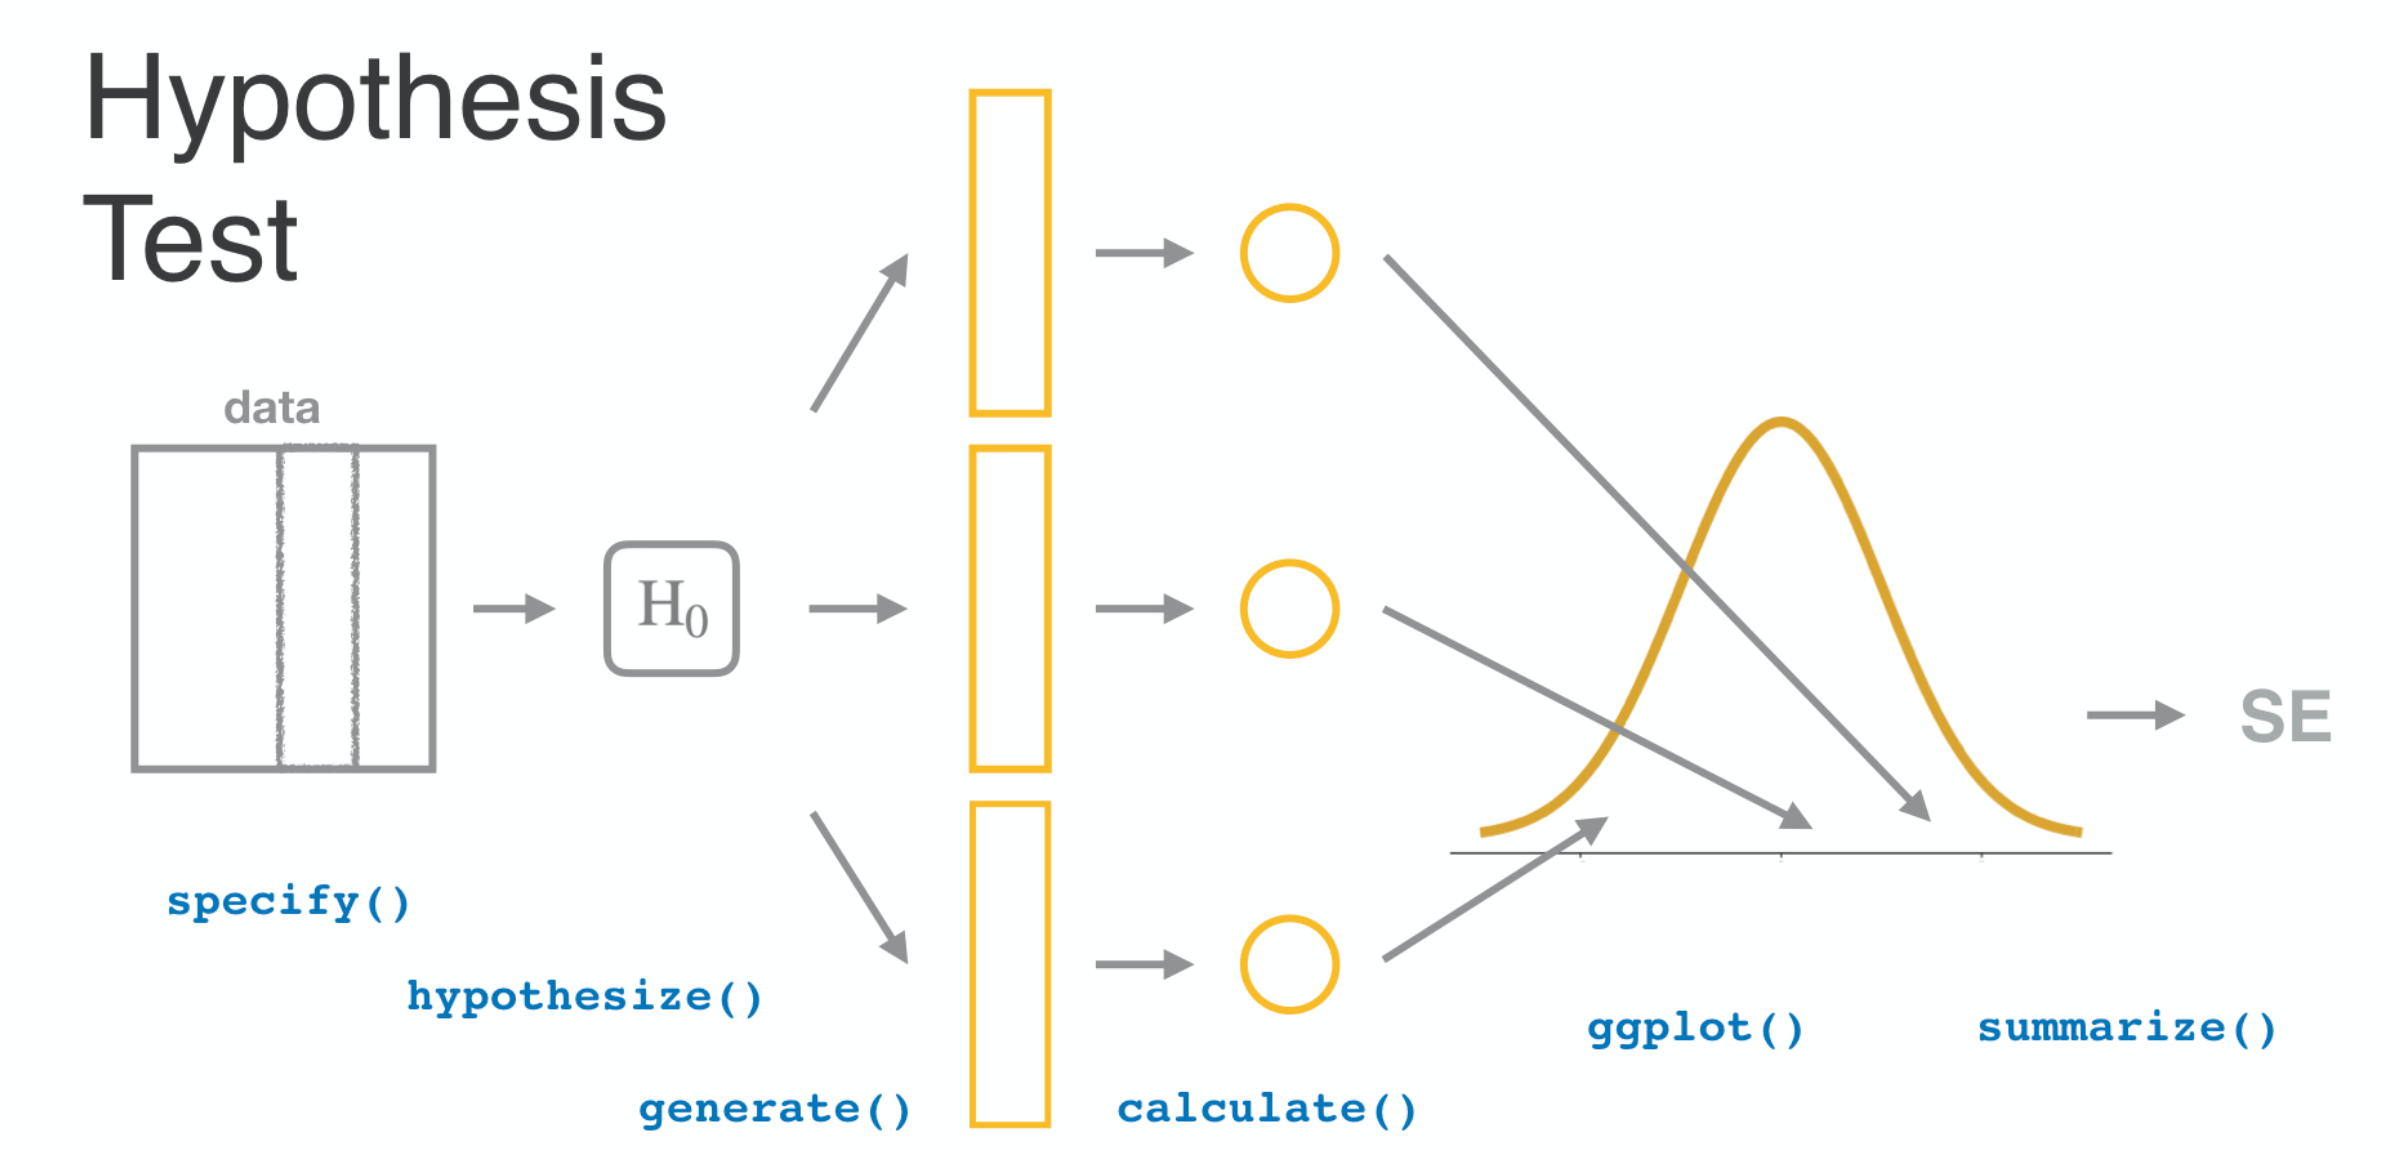
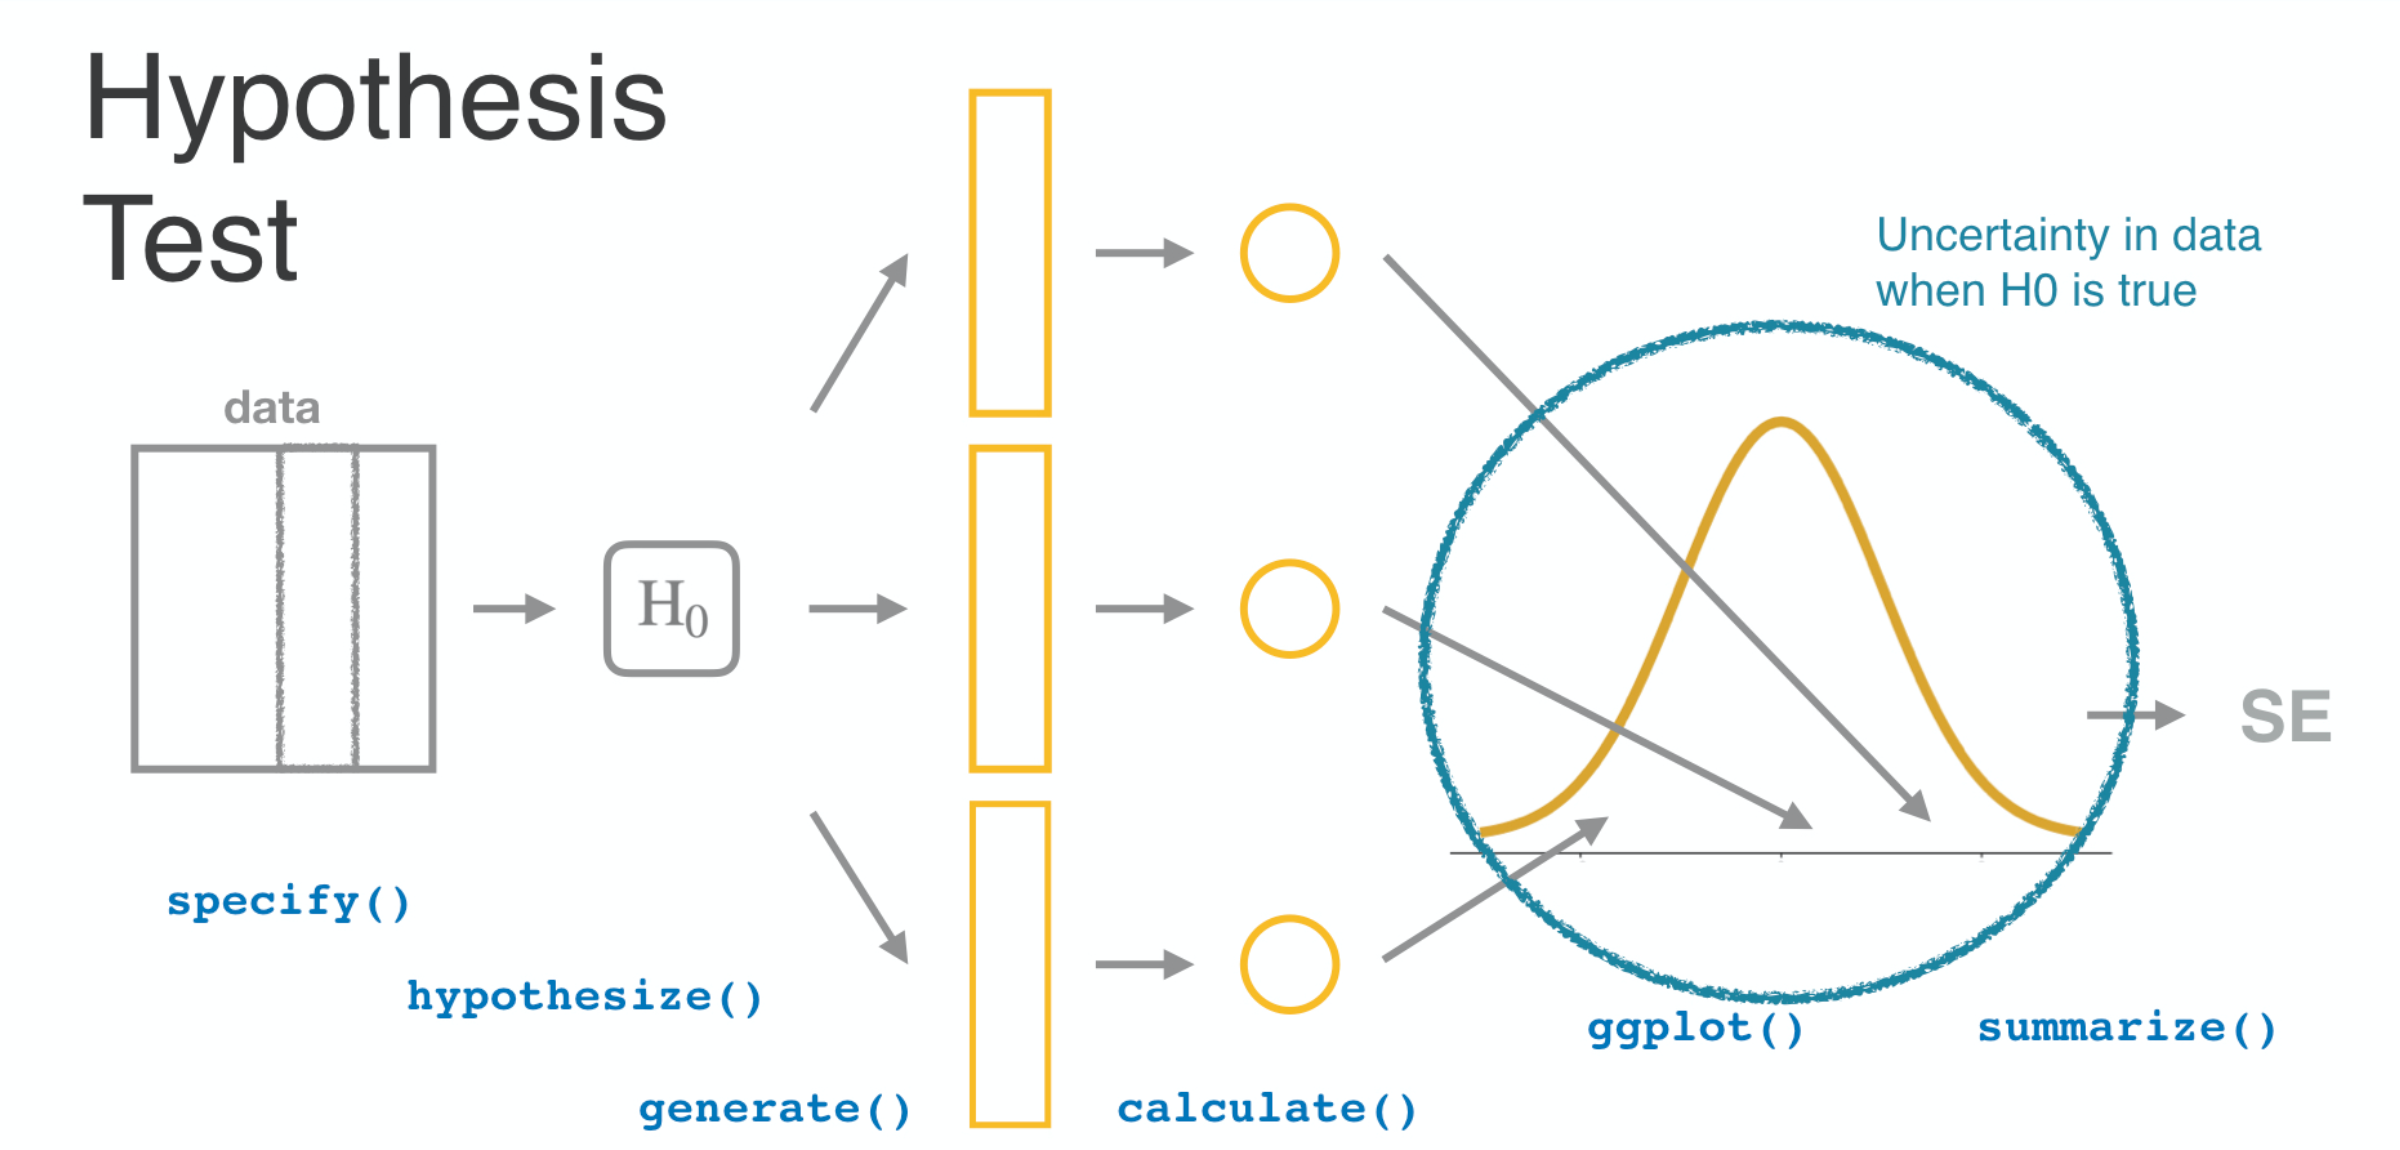
Hypothesetoets voor een proportie
Inferentie voor categorische gegevens in R

Andrew Bray
Assistant Professor of Statistics at Reed College


Is de helft van de Amerikanen voor de doodstraf?
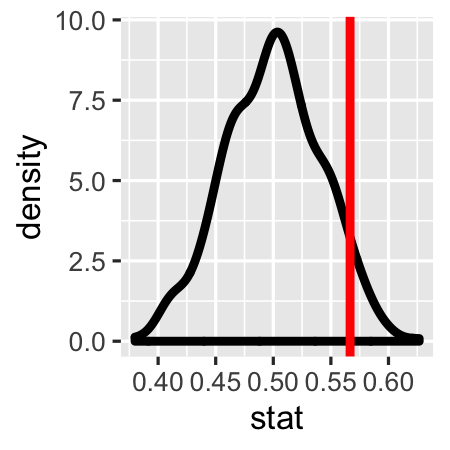
Is de helft van de Amerikanen voor de doodstraf?
Inferentie voor categorische gegevens in R
Andrew Bray
Assistant Professor of Statistics at Reed College

