Metrics visualiseren
Market Basket-analyse in R

Christopher Bruffaerts
Statistician
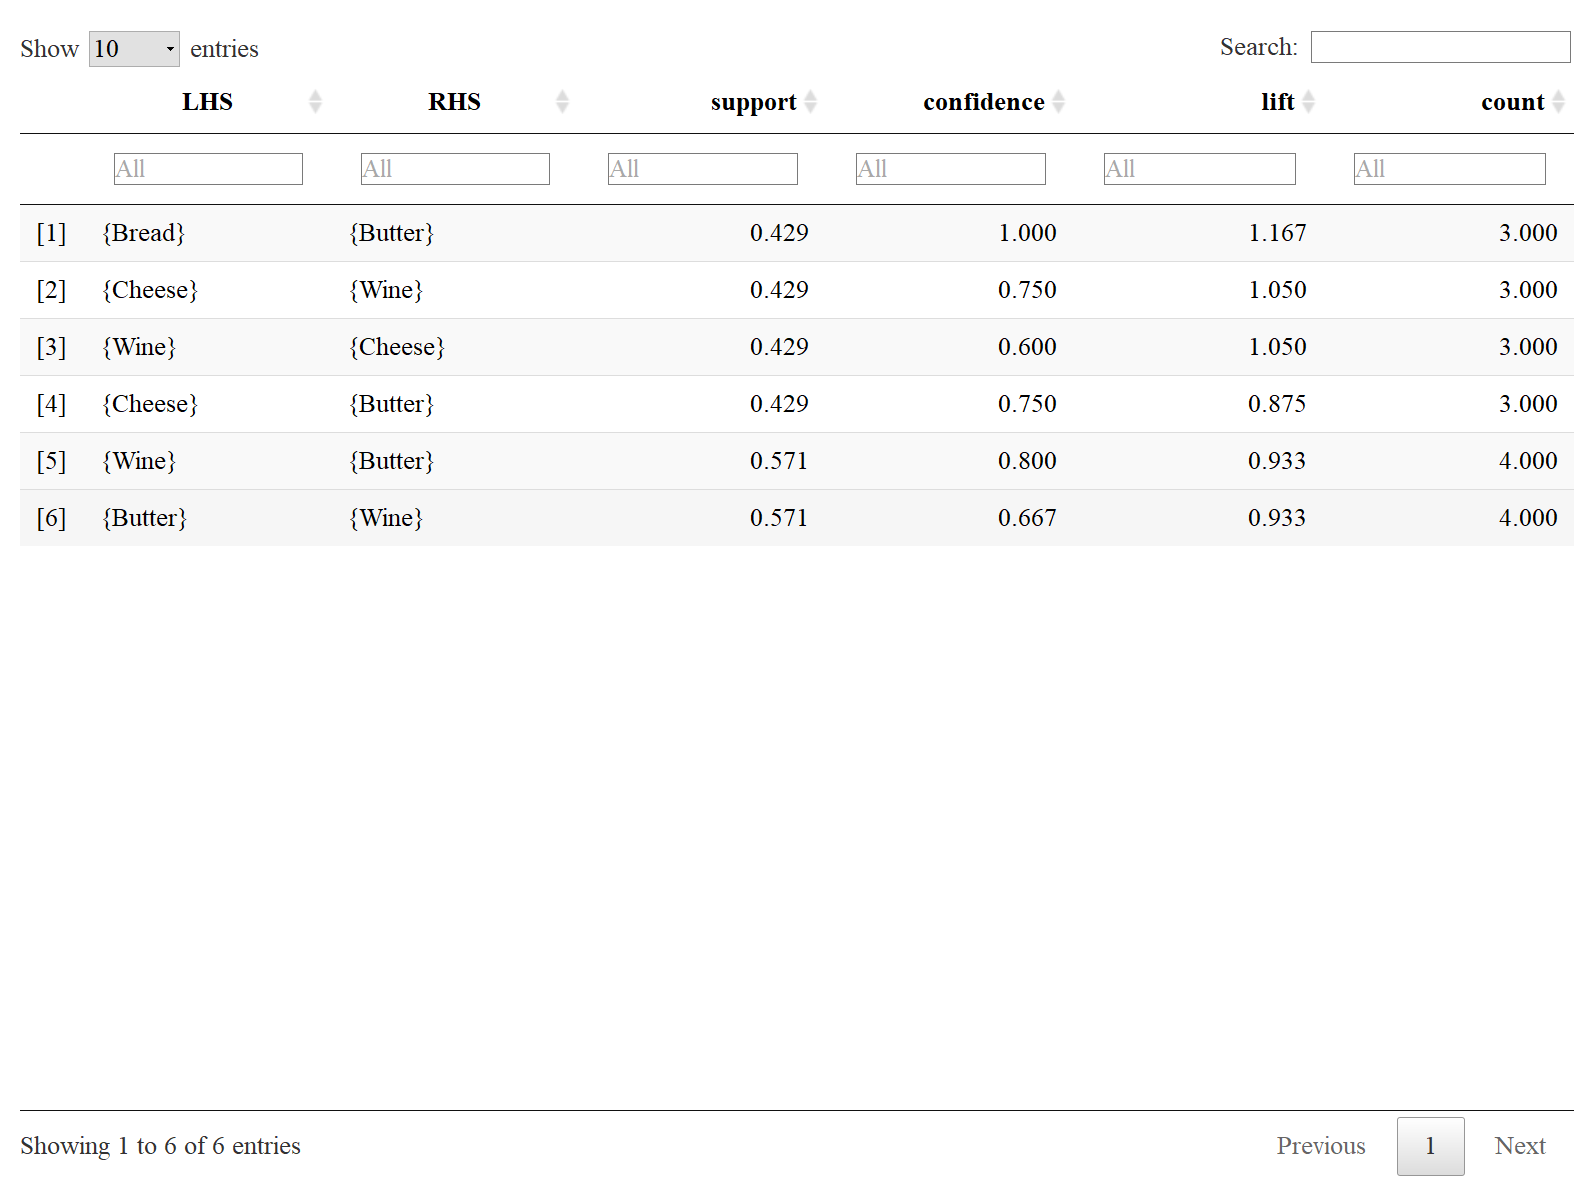
Interactieve tabel met metrics
HTML-tabel
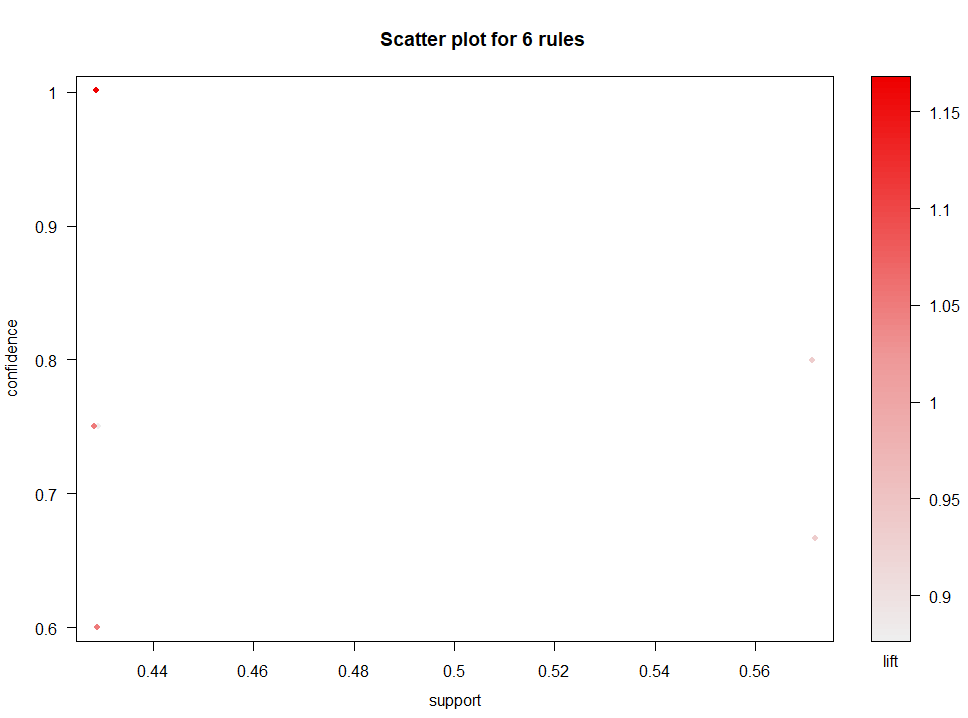
Introductie scatterplots
Scatterplot uit arulesViz
plot(rules)
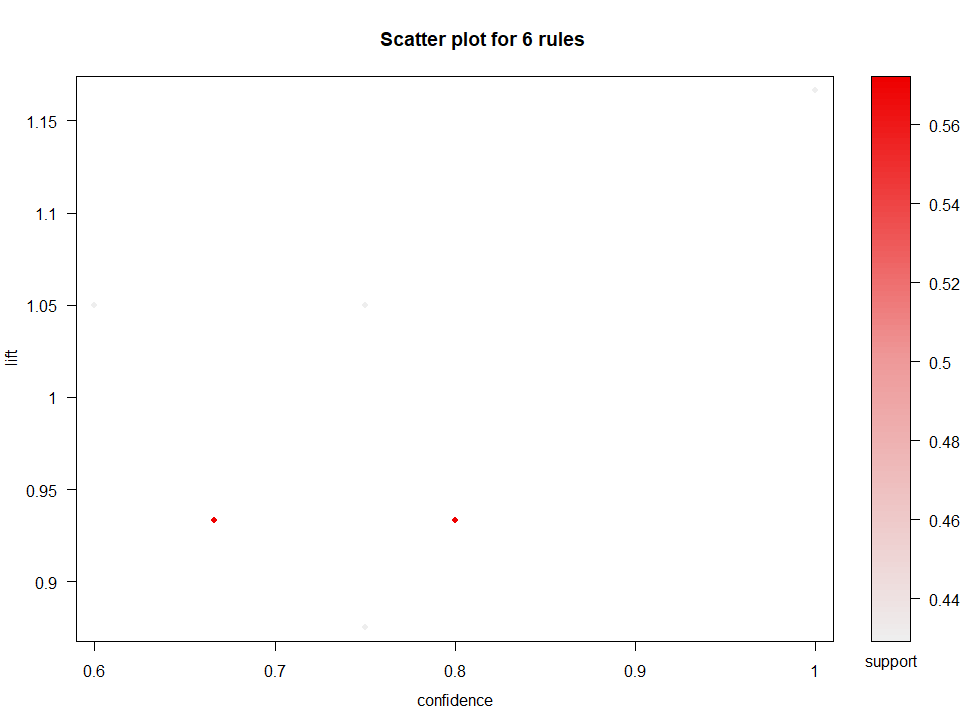
Flexibele arules-plots
Voorbeeld
plot(rules, measure = c("confidence", "lift"),
     shading = "support",
     method = "scatterplot")
Andere arules-plots
Jitter toepassen op je plots
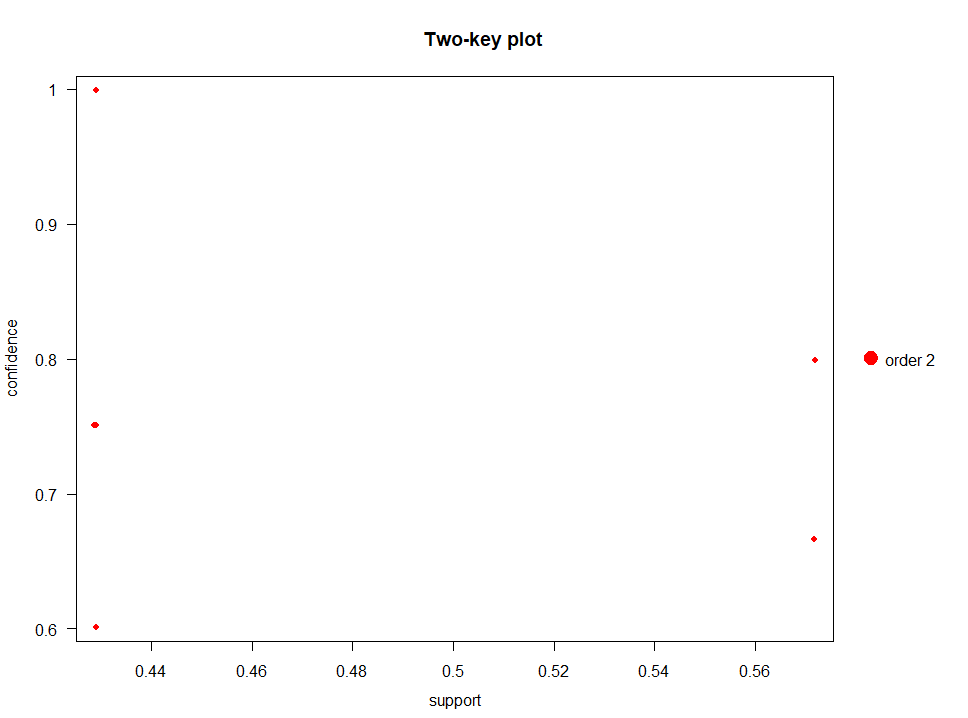
Zonder jitter
plot(rules, method = "two-key plot")
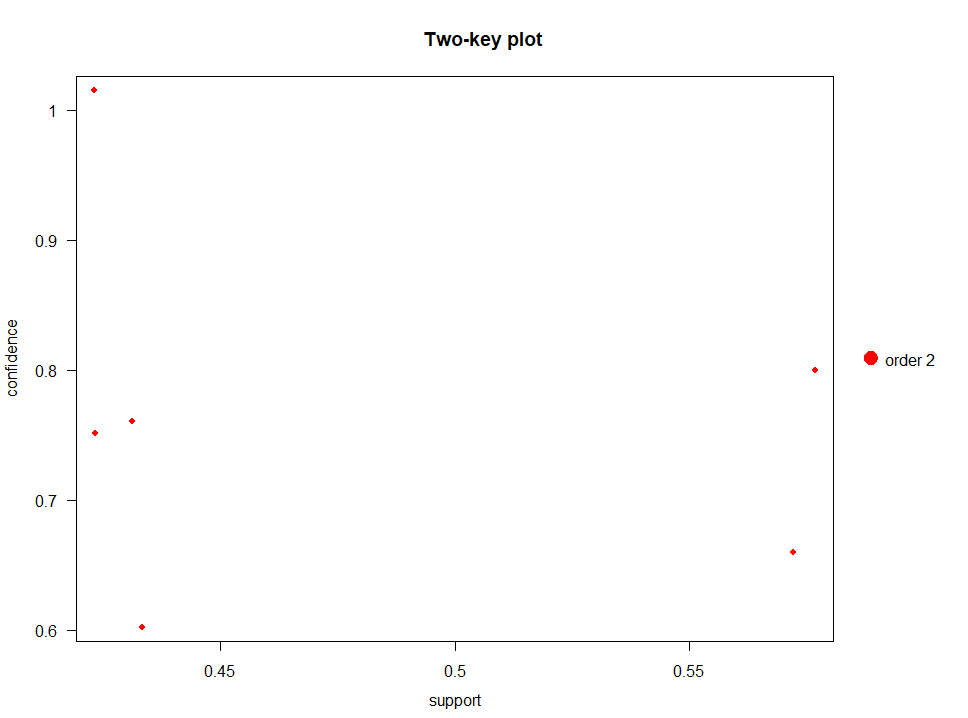
Met jitter
plot(rules, method = "two-key plot",jitter = 2)
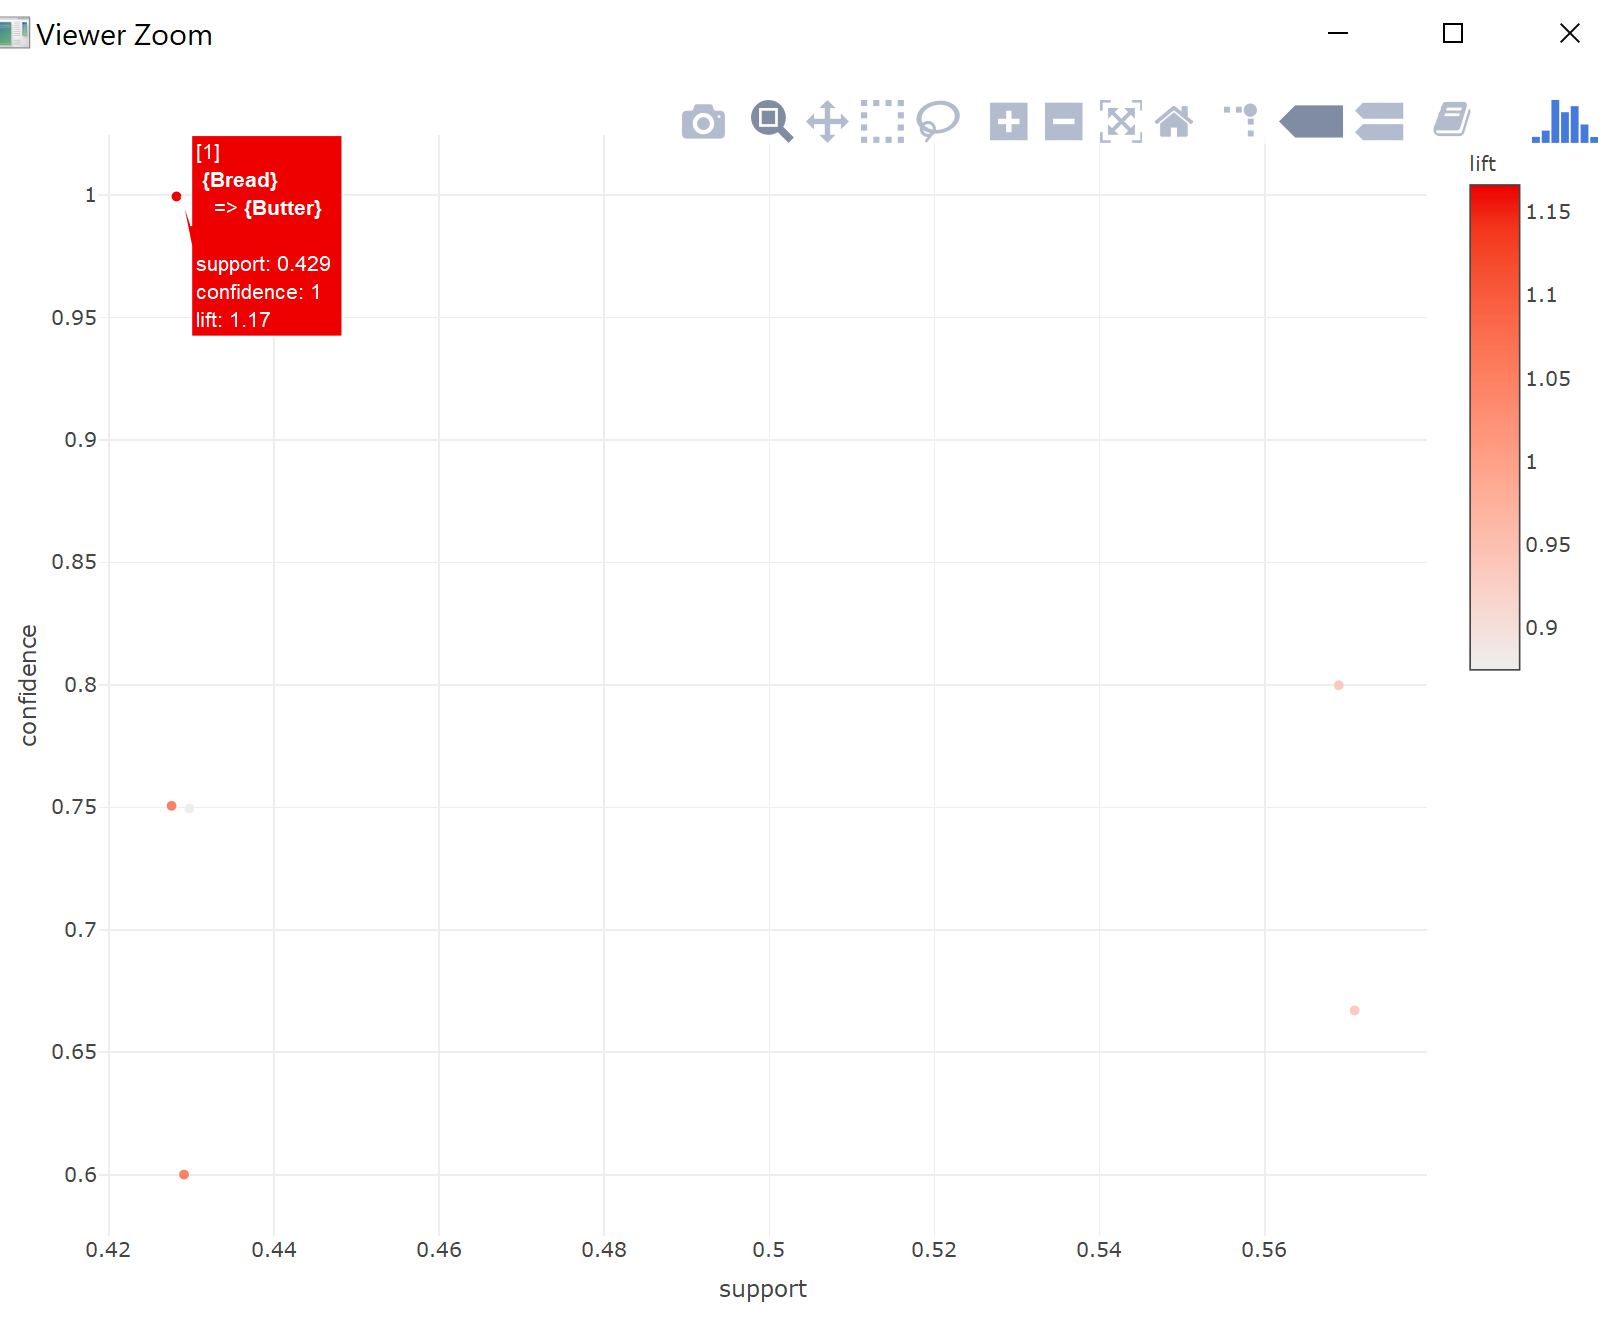
Interactieve arules-plots
Van statisch naar interactief