Terugblik op transacties
Market Basket-analyse in R

Christopher Bruffaerts
Statistician
Belangrijk bij market-basketanalyse
Market-basketanalyse
Focus op het wat, niet op het hoeveel;
oftewel: wat zit er in mandjes van klanten?
Groceries-dataset
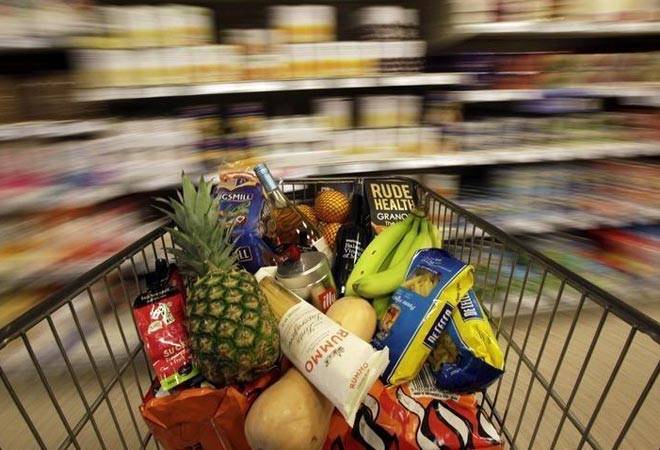
Terug naar de supermarkt

Dichtheid van Groceries
# Plotting a sample of 200 transactions
image(sample(Groceries, 200))
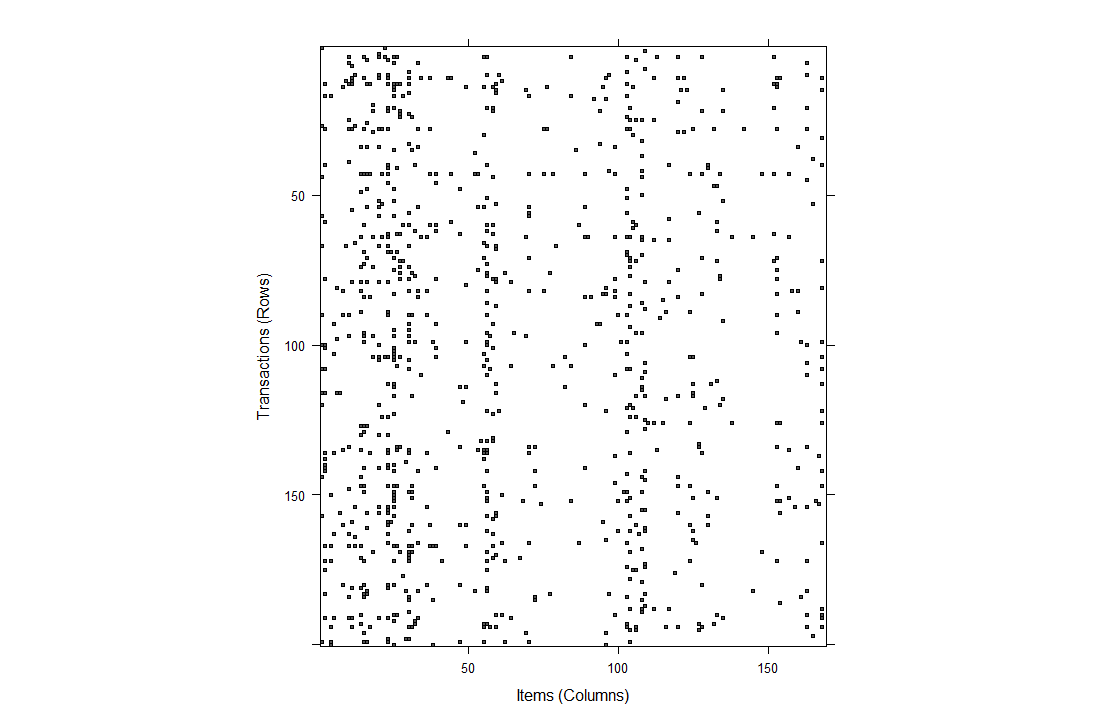
1 De dichtheid van de itemmatrix is 2,6%.
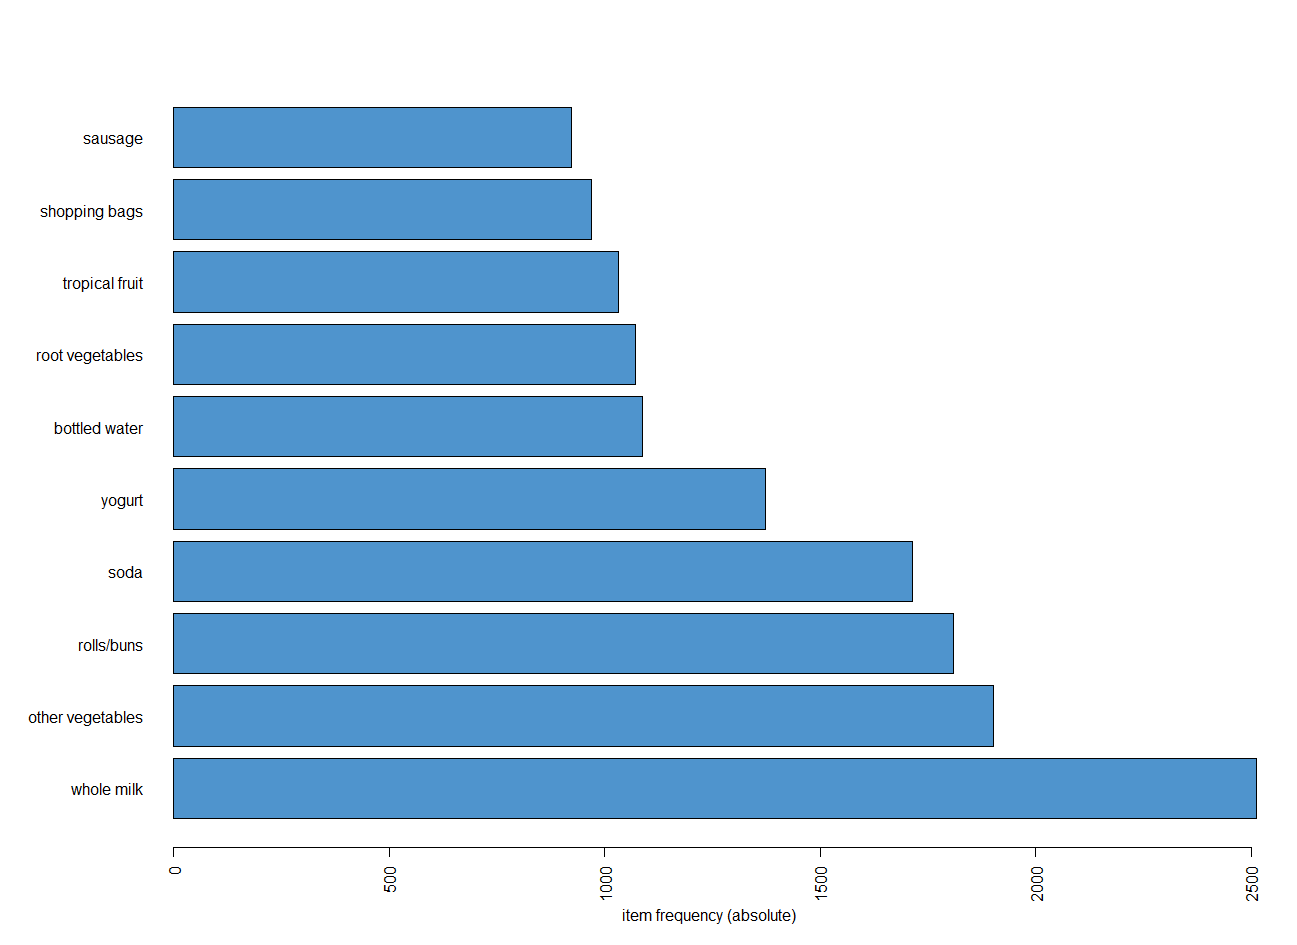
Meest en minst populaire items
Populairste items
itemFrequencyPlot(Groceries,type="relative",
                  topN=10,horiz=TRUE,col='steelblue3')
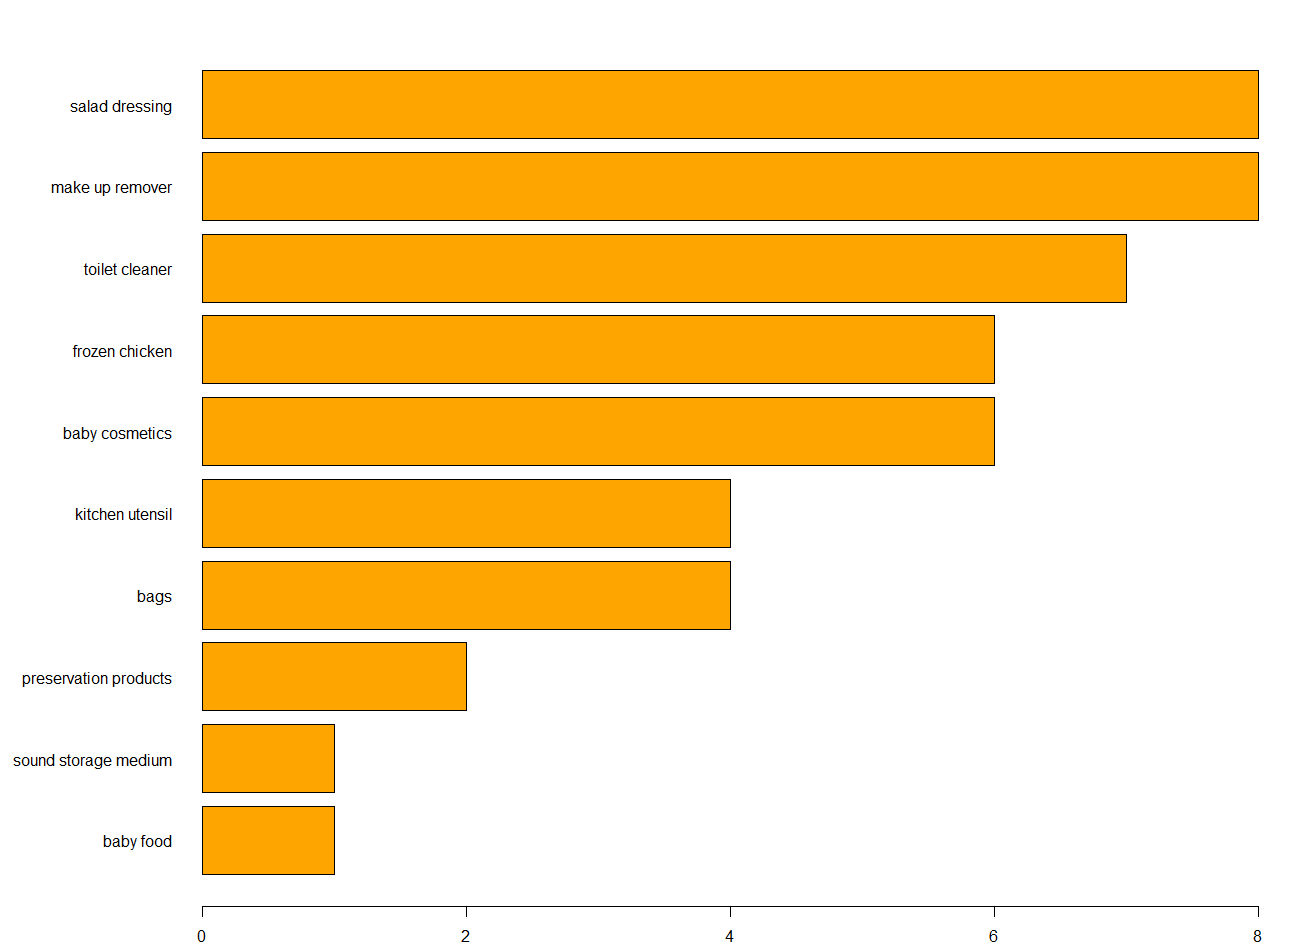
Minst populaire items
par(mar=c(2,10,2,2), mfrow=c(1,1))
barplot(sort(table(unlist(LIST(Groceries))))[1:10],
        horiz = TRUE,las = 1,col='orange')
MovieLens-dataset
MovieLens: webgebaseerd aanbevelingssysteem dat films aanraadt om te kijken.