t-Distributed Stochastic Neighbor Embedding (t-SNE)

Dimensionality Reduction in R

Matt Pickard

Owner, Pickard Predictives, LLC

t-SNE vs PCA-tabel

Dimensionality Reduction in R

t-SNE vs PCA-tabel

Dimensionality Reduction in R

t-SNE vs PCA-tabel

Dimensionality Reduction in R

t-SNE vs PCA-tabel

Dimensionality Reduction in R

t-SNE vs PCA-tabel

Dimensionality Reduction in R

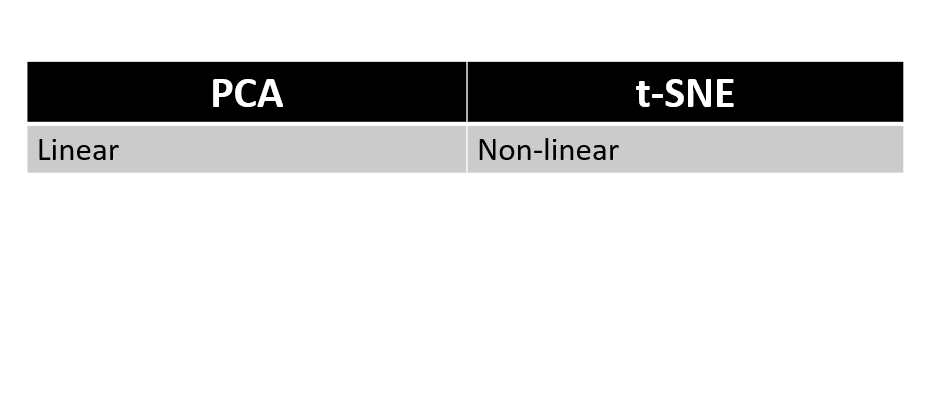
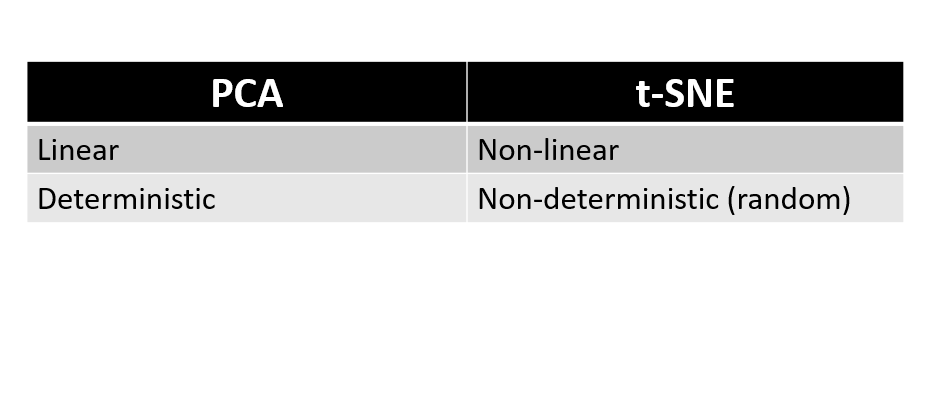
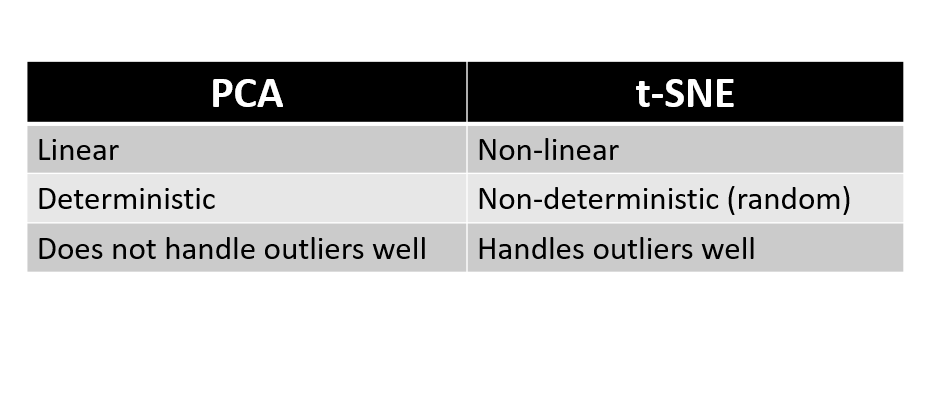
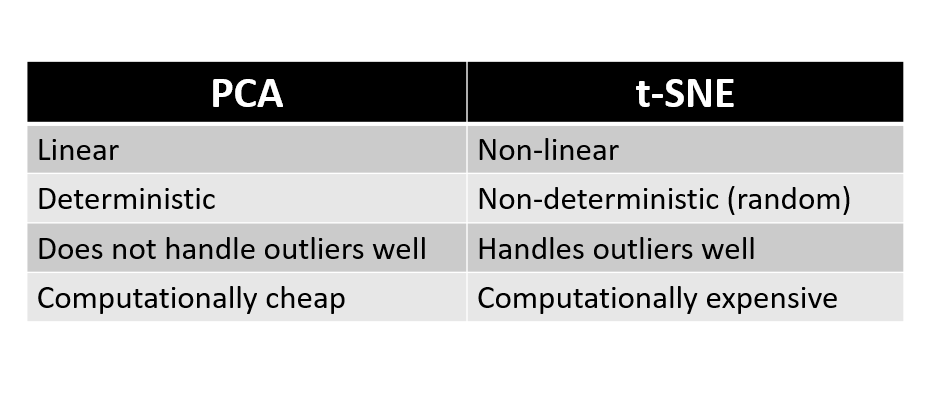
PCA en t-SNE plotten
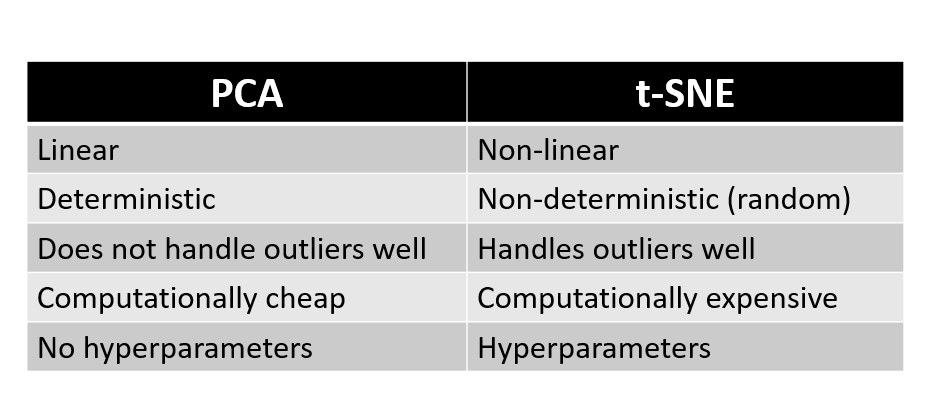
PCA

PCA-plot

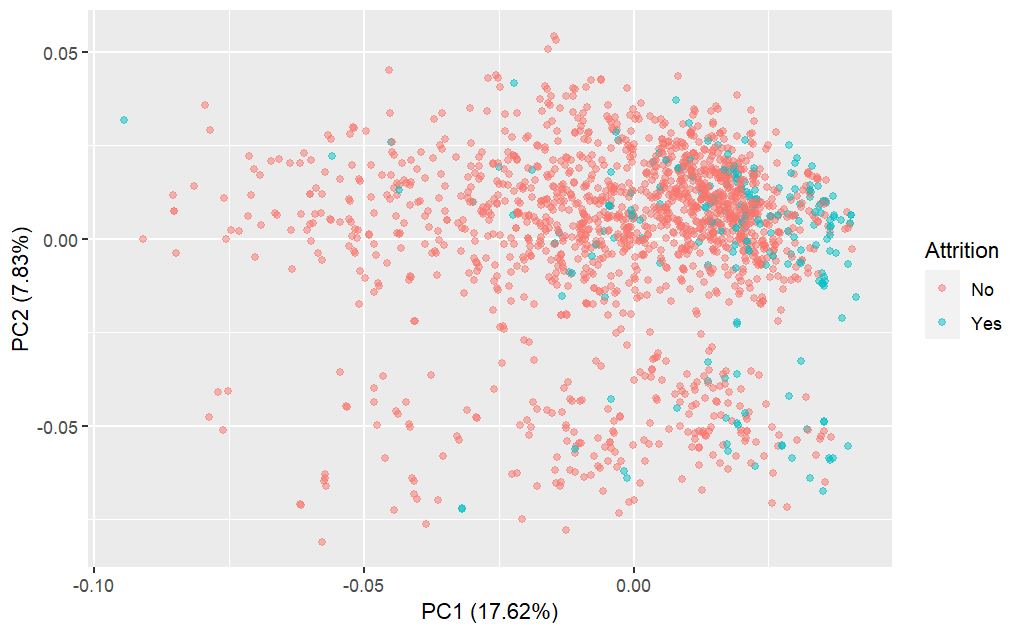
Behoudt globale structuur

t-SNE

t-SNE-plot

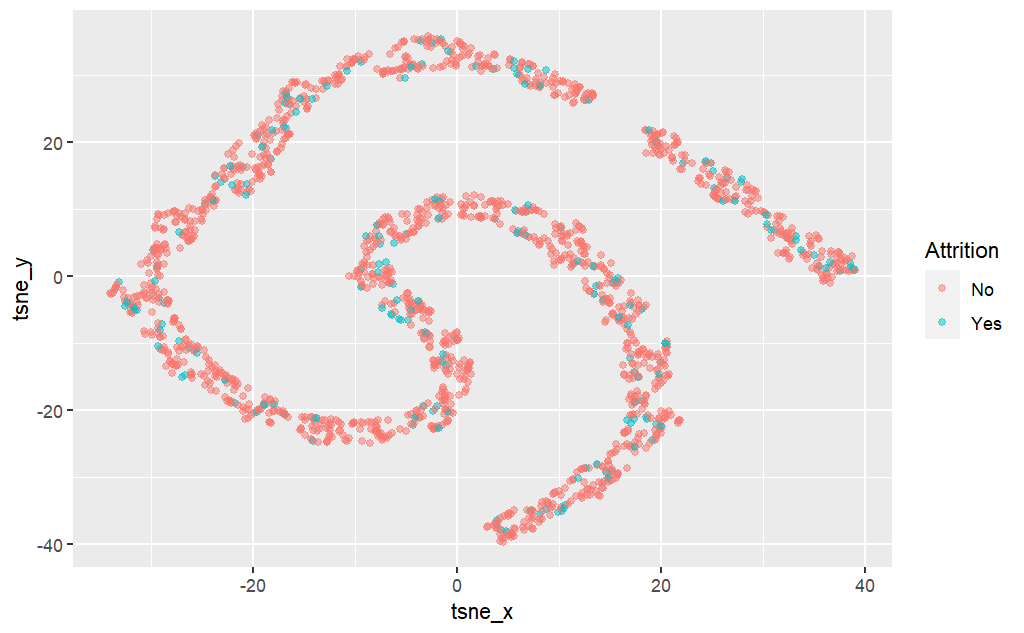
Behoudt lokale structuur (houdt buren bij elkaar)

Dimensionality Reduction in R

t-SNE-hyperparameters

  • Perplexity - bepaalt het aantal dichtstbijzijnde buren
  • Learning rate - snelheid waarmee NN-gewichten worden aangepast
  • Iterations - aantal backpropagation-iteraties

t-SNE

t-SNE-plot

Dimensionality Reduction in R

t-SNE in R

library(Rtsne)

set.seed(1234) tsne <- Rtsne(attrition_df %>% select(-Attrition))
tsne_df <- attrition_df %>% bind_cols(tsne_x = tsne$Y[,1], tsne_y = tsne$Y[,2])
tsne_df %>% ggplot(aes(x = tsne_x, y = tsne_y, color = Attrition)) + geom_point(alpha = 0.5)
Dimensionality Reduction in R

t-SNE-plot

t-SNE-plot

Dimensionality Reduction in R

Laten we oefenen!

Dimensionality Reduction in R

Preparing Video For Download...