Lineair regressiemodel
Oefenen met statistiek-vragen voor sollicitaties in R

Zuzanna Chmielewska
Actuary
Lineair regressiemodel

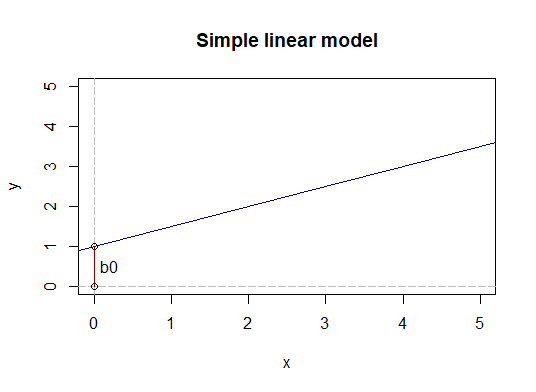
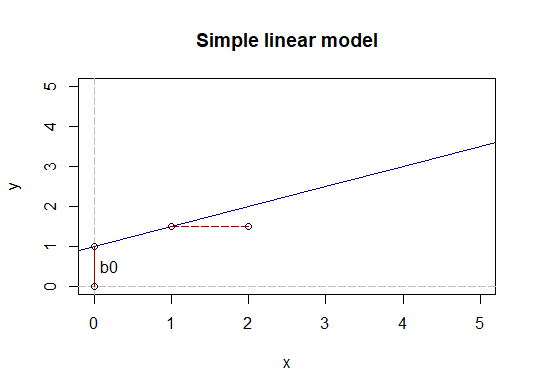
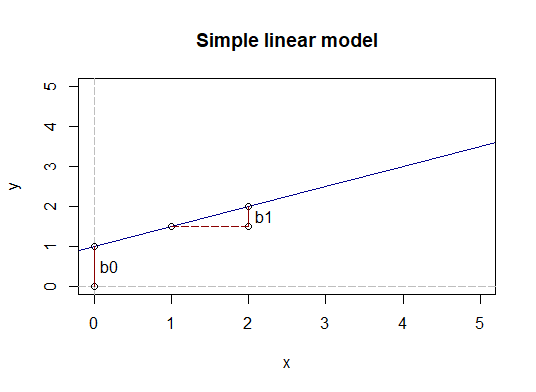
Lineair regressiemodel

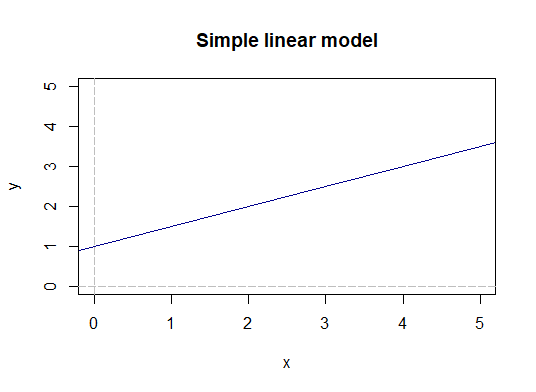 $$ \hat{y_i} = \beta_0 + \beta_1 \cdot x_{i} $$
 $$ \hat{y_i} = \beta_0 + \beta_1 \cdot x_{i} $$
 $$ \hat{y_i} = \beta_0 + \beta_1 \cdot x_{i} $$
 $$ \hat{y_i} = \beta_0 + \beta_1 \cdot x_{i} $$
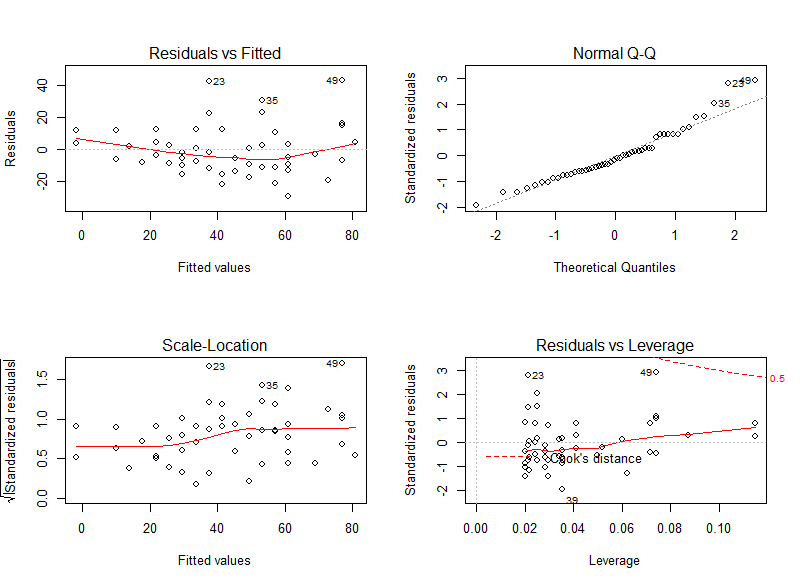
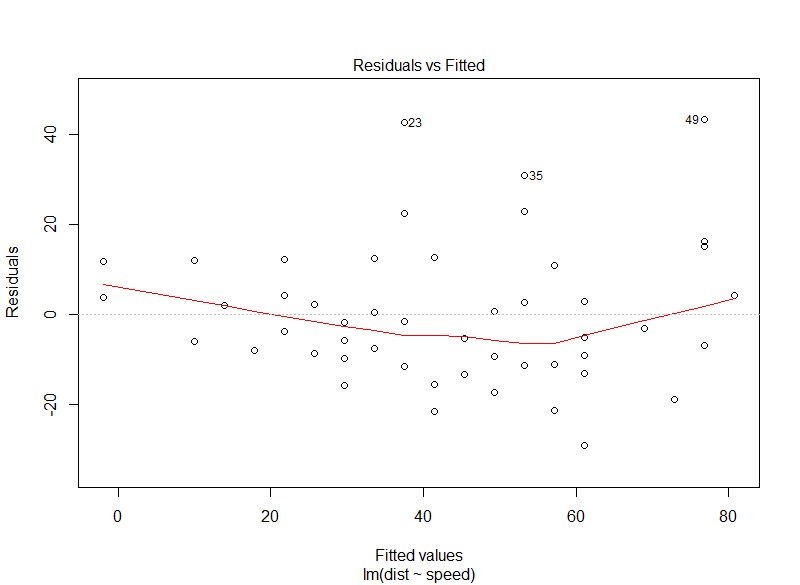
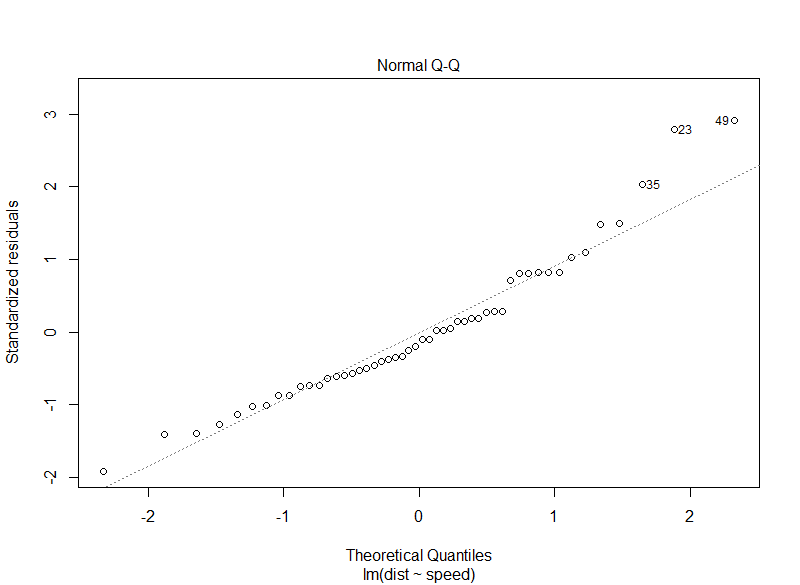
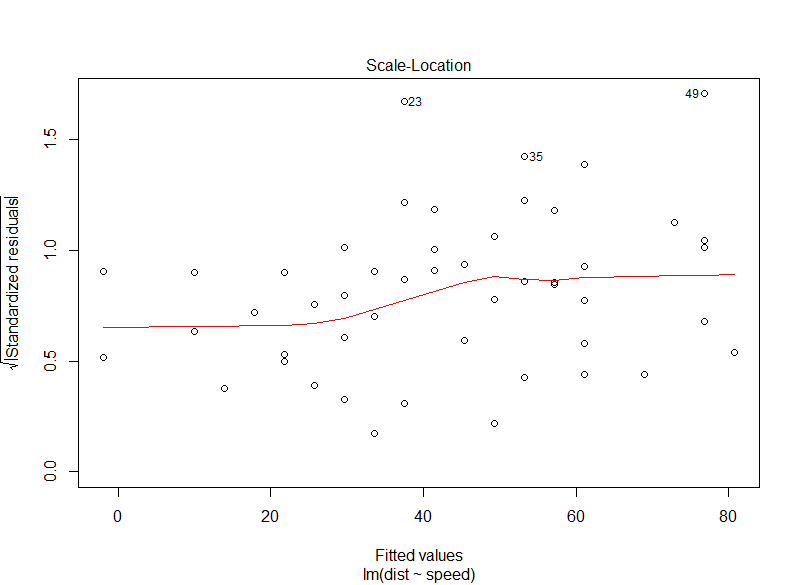
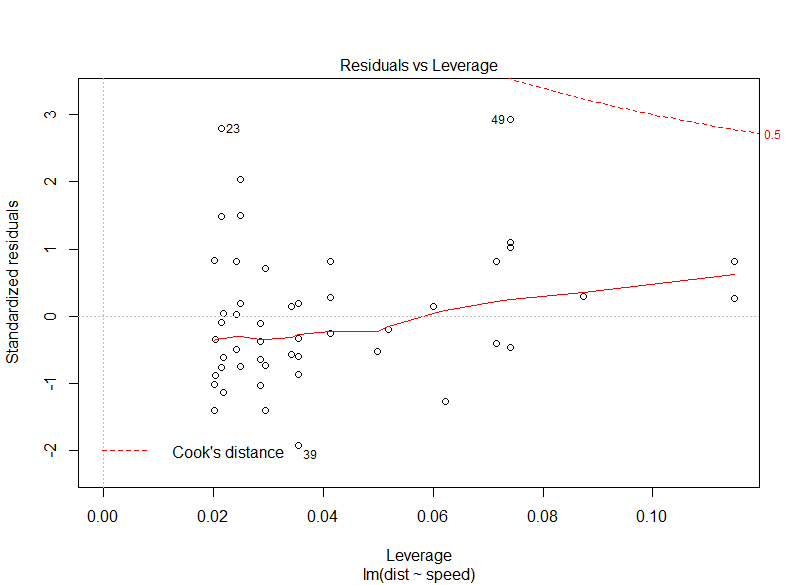
Diagnostische plots
model <- lm(dist ~ speed, data = cars)
plot(model)