Lineaire regressies en pairs bootstrap
Casestudies in statistisch denken

Justin Bois
Lecturer, Caltech
Bacteriële groei
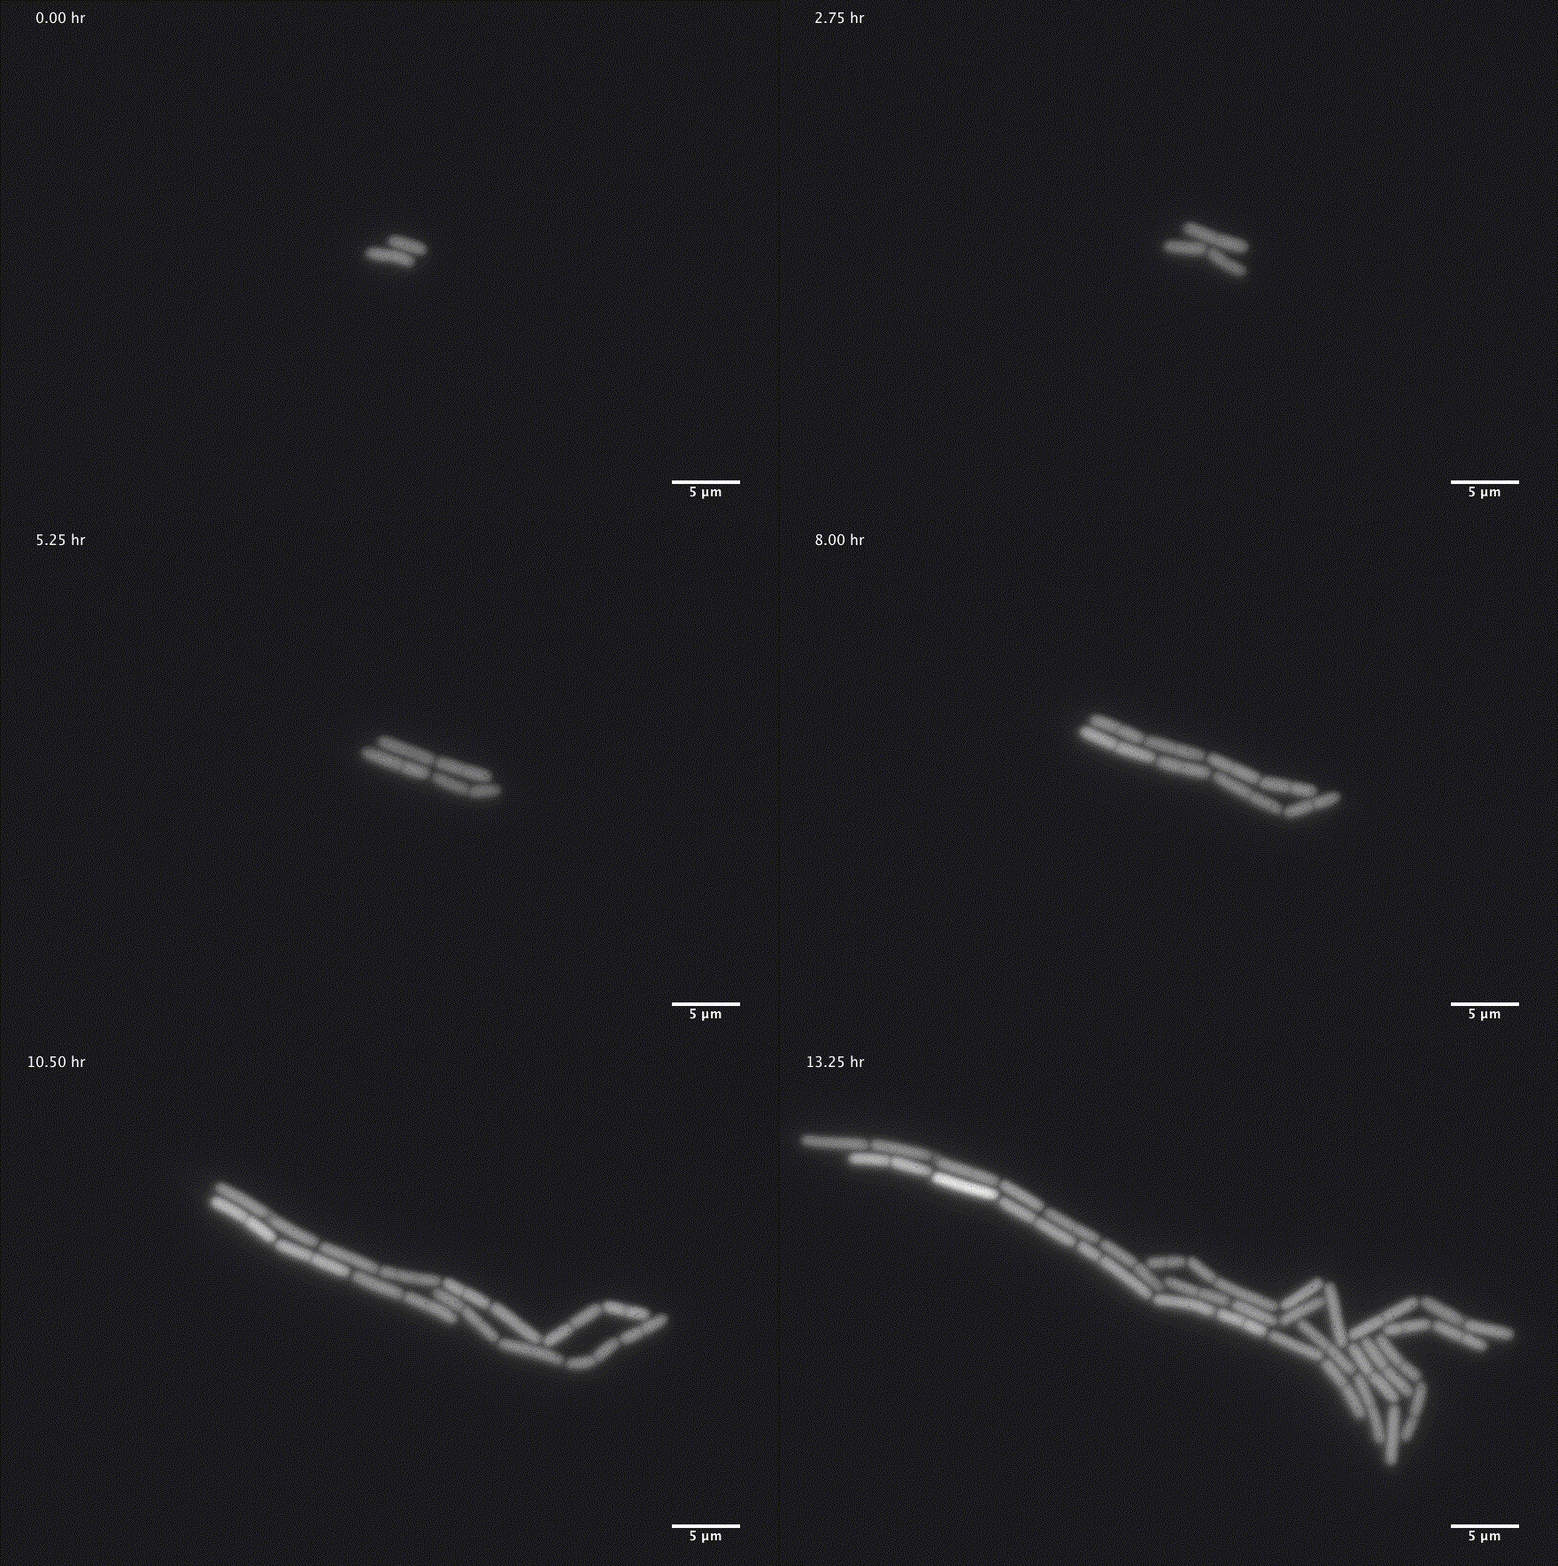
1 Afbeeldingen met dank aan Jin Park en Michael Elowitz, Caltech
Bacteriële groei
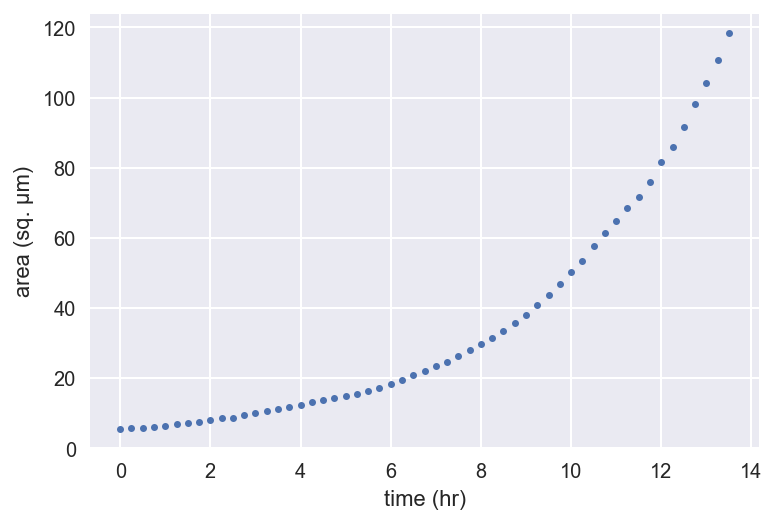
_ = plt.semilogy(t, bac_area, marker='.', linestyle='none')
_ = plt.xlabel('time (hr)')
_ = plt.ylabel('area (sq. µm)')
plt.show()

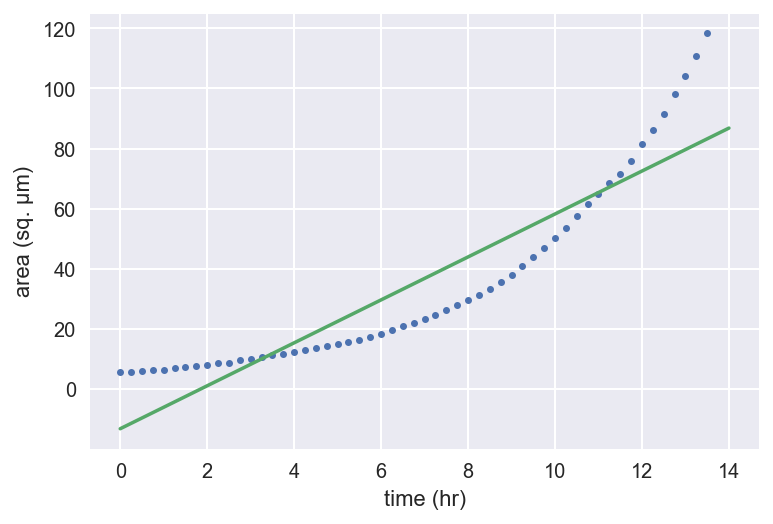
Lineaire regressie met np.polyfit()
slope, intercept = np.polyfit(t, bac_area, 1)
t_theor = np.array([0, 14])
bac_area_theor = slope * t_theor + intercept
_ = plt.plot(t, bac_area, marker='.', linestyle='none')
_ = plt.plot(t_theor, bac_area_theor)
_ = plt.xlabel('time (hr)')
_ = plt.ylabel('area (sq. µm)')
plt.show()
Regressie van bacteriële groei
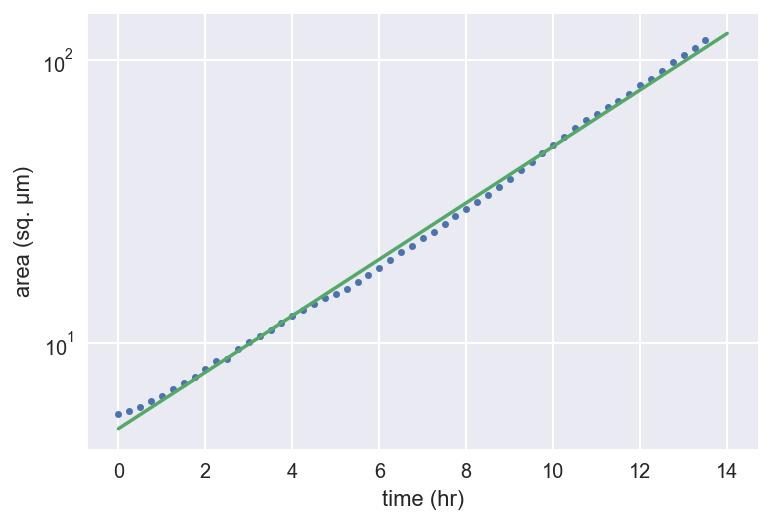
Semilog-lineaire regressie met np.polyfit()
slope, intercept = np.polyfit(t, np.log(bac_area), 1)
t_theor = np.array([0, 14])
bac_area_theor = np.exp(slope * t_theor + intercept)
_ = plt.semilogy(t, bac_area, marker='.', linestyle='none')
_ = plt.semilogy(t_theor, bac_area_theor)
_ = plt.xlabel('time (hr)')
_ = plt.ylabel('area (sq. µm)')
plt.show()
Regressie van bacteriële groei
Pairs bootstrap
- Resample data in paren
- Bereken helling en intercept uit geresamplede data
- Elke helling en elk intercept is een bootstrap-replica
- Bepaal betrouwbaarheidsintervallen uit percentielen van bootstrap-replica's
Pairs bootstrap
# Draw 10000 pairs bootstrap reps slope_reps, int_reps = dcst.draw_bs_pairs_linreg( x_data, y_data, size=10000 )# Compute 95% confidence interval of slope slope_conf_int = np.percentile(slope_reps, [2.5, 97.5])

