Keuzedata visualiseren

Keuzemodellering voor marketing in R

Elea McDonnell Feit

Assistant Professor of Marketing, Drexel University

xtabs(~ trans, data = sportscar)
trans
  auto manual 
  3001   2999
xtabs(~ trans + choice, data = sportscar)
        choice
trans       0    1
  auto   1627 1374
  manual 2373  626
xtabs(choice ~ trans, data=sportscar)
trans
  auto manual 
  1374    626
Keuzemodellering voor marketing in R

De output van xtabs() plotten

plot(xtabs(~ trans + choice, data = sportscar))
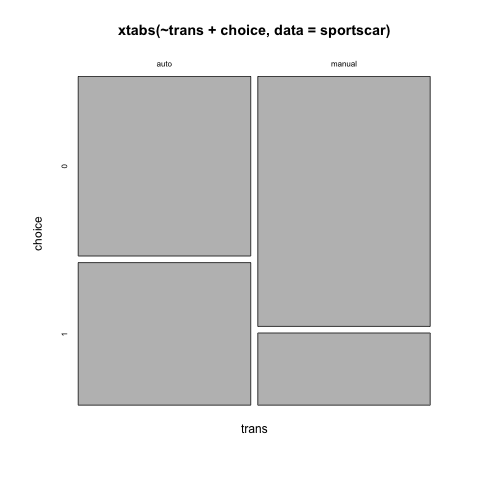
Aantallen keuze per transmissie

Keuzemodellering voor marketing in R

Transmissiekeuze per segment

plot(xtabs(~ trans + segment + choice, data = sportscar))
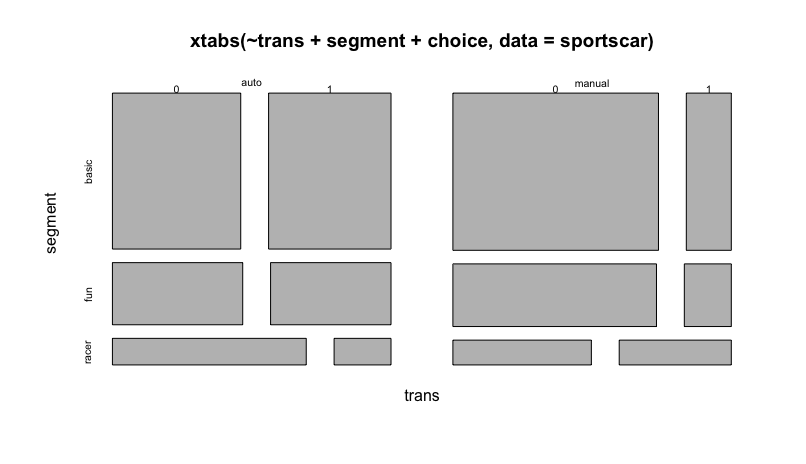
Aantallen keuze per transmissie en segment

Keuzemodellering voor marketing in R

Laten we oefenen!

Keuzemodellering voor marketing in R

Preparing Video For Download...