Tijdreeksen visualiseren
Introductie tot datavisualisatie met Julia

Gustavo Vieira Suñe
Data Analyst
Tijdreeksen
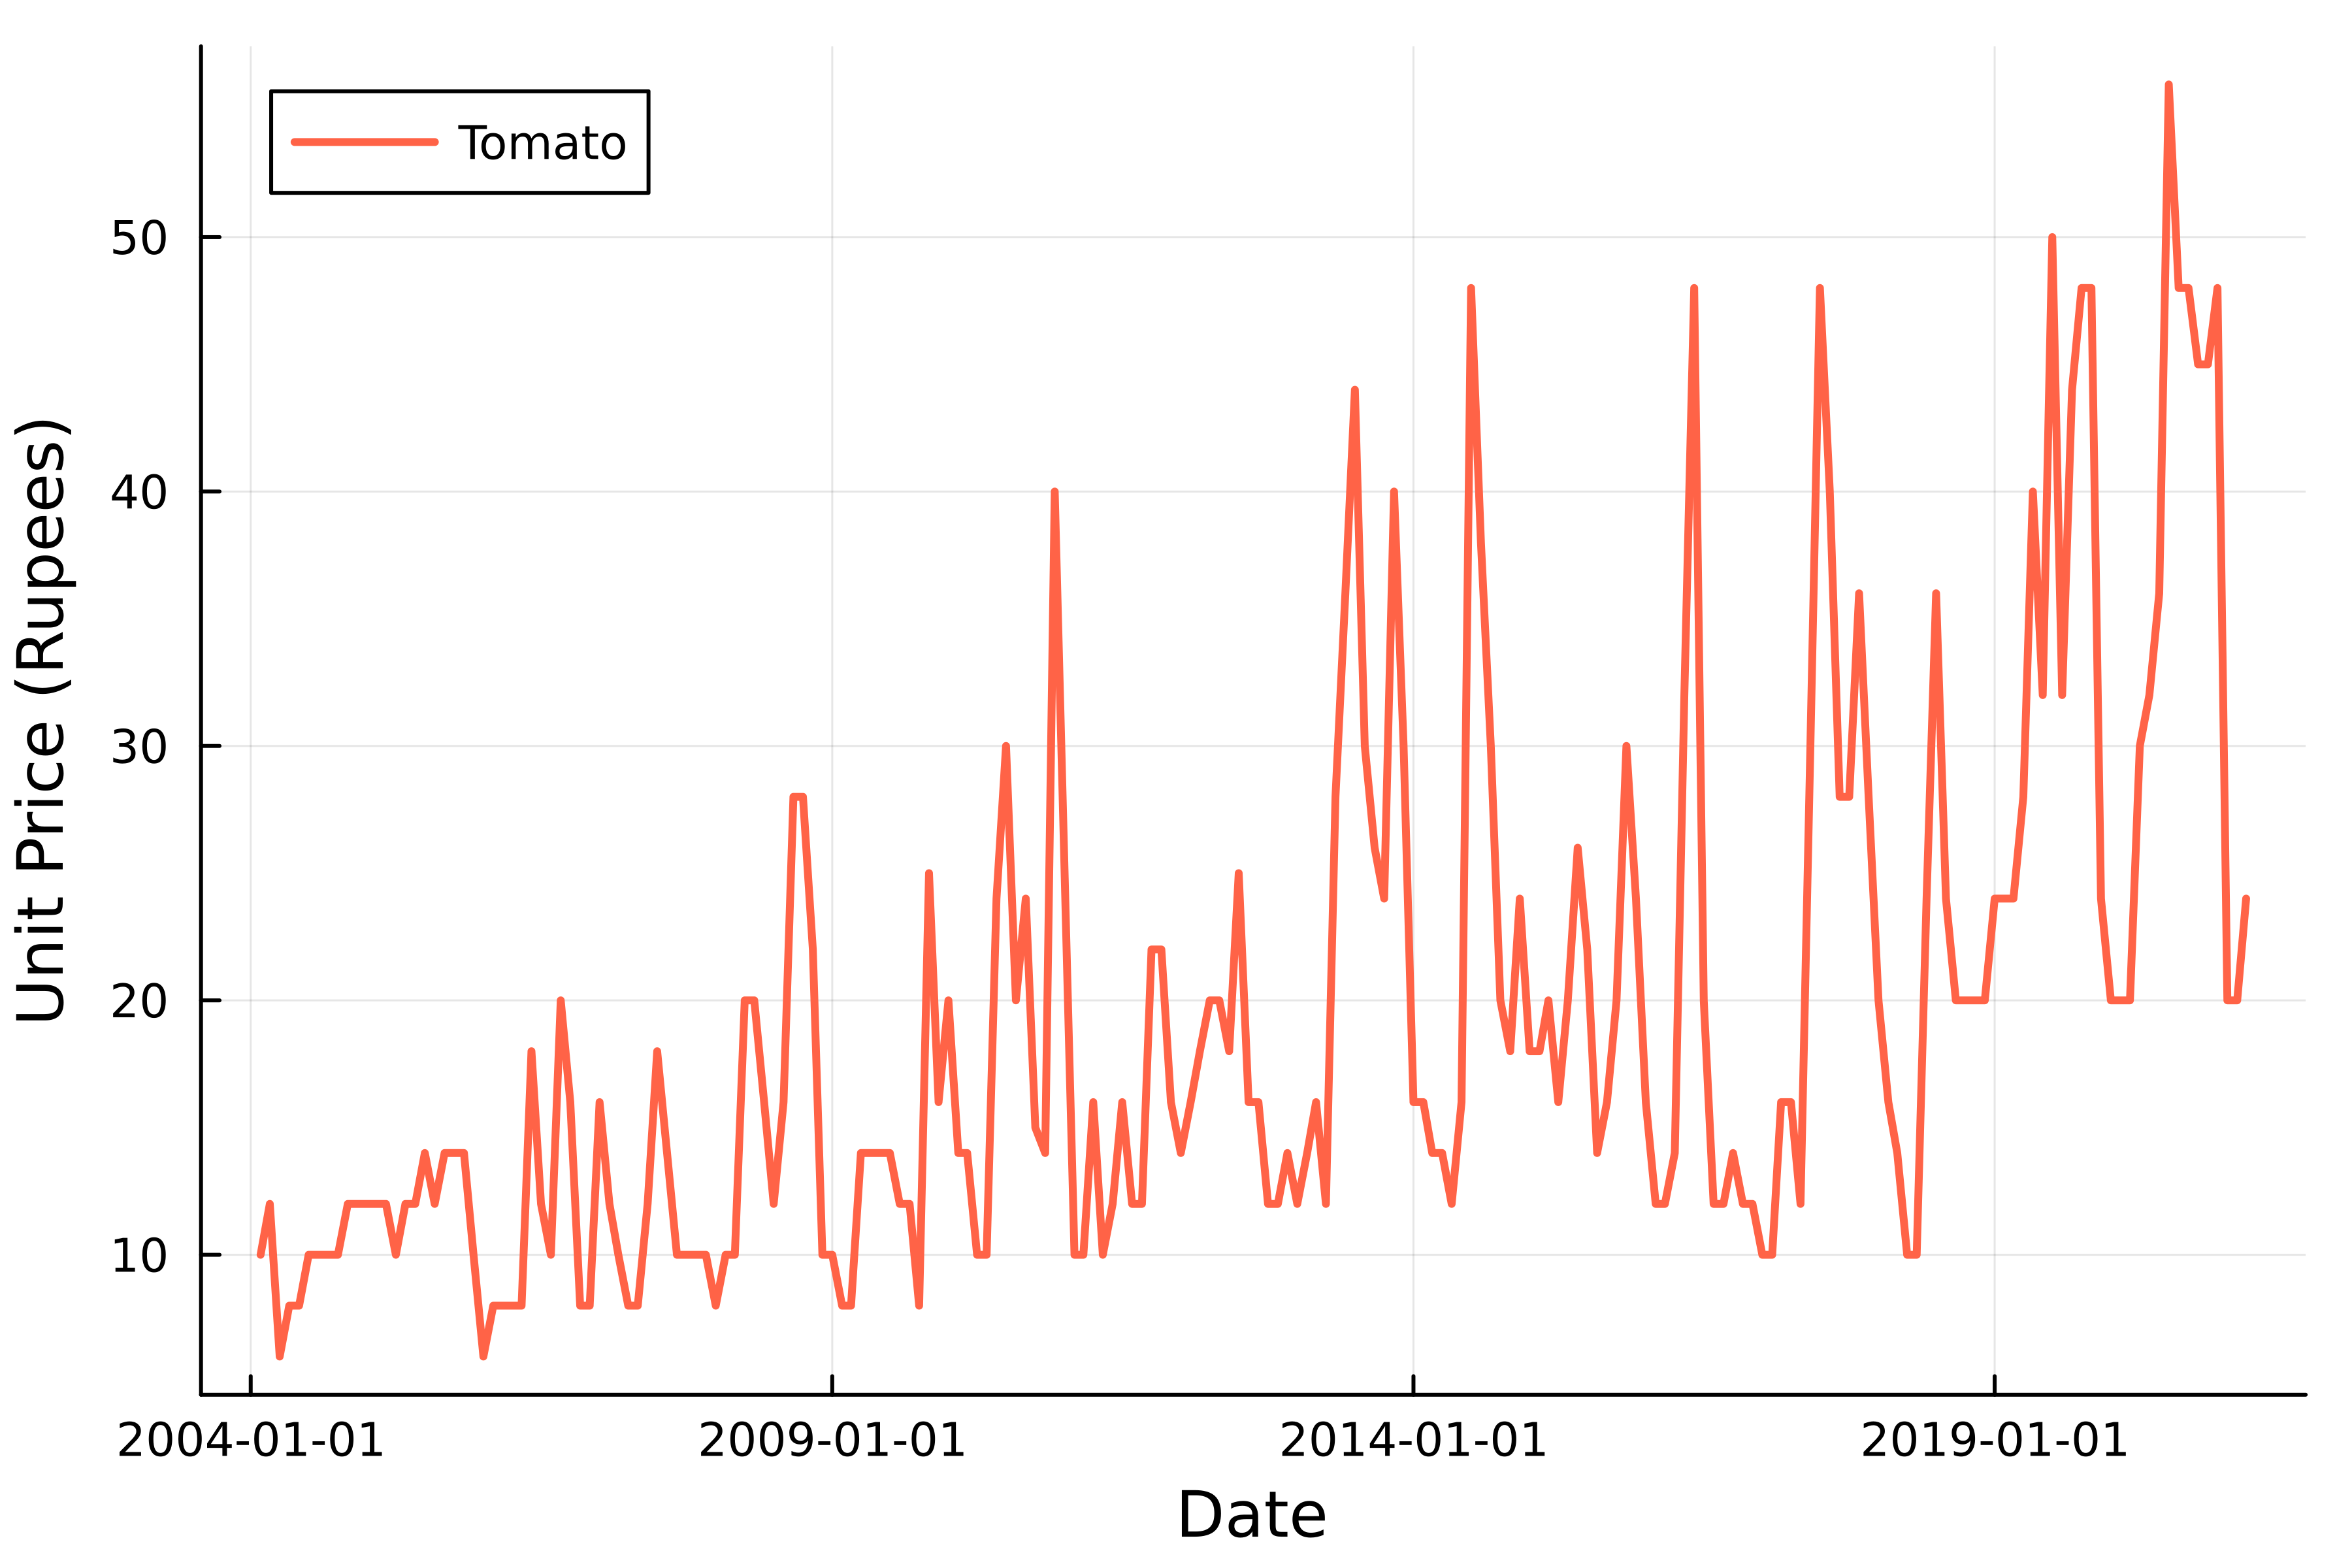
Tomatenprijzen
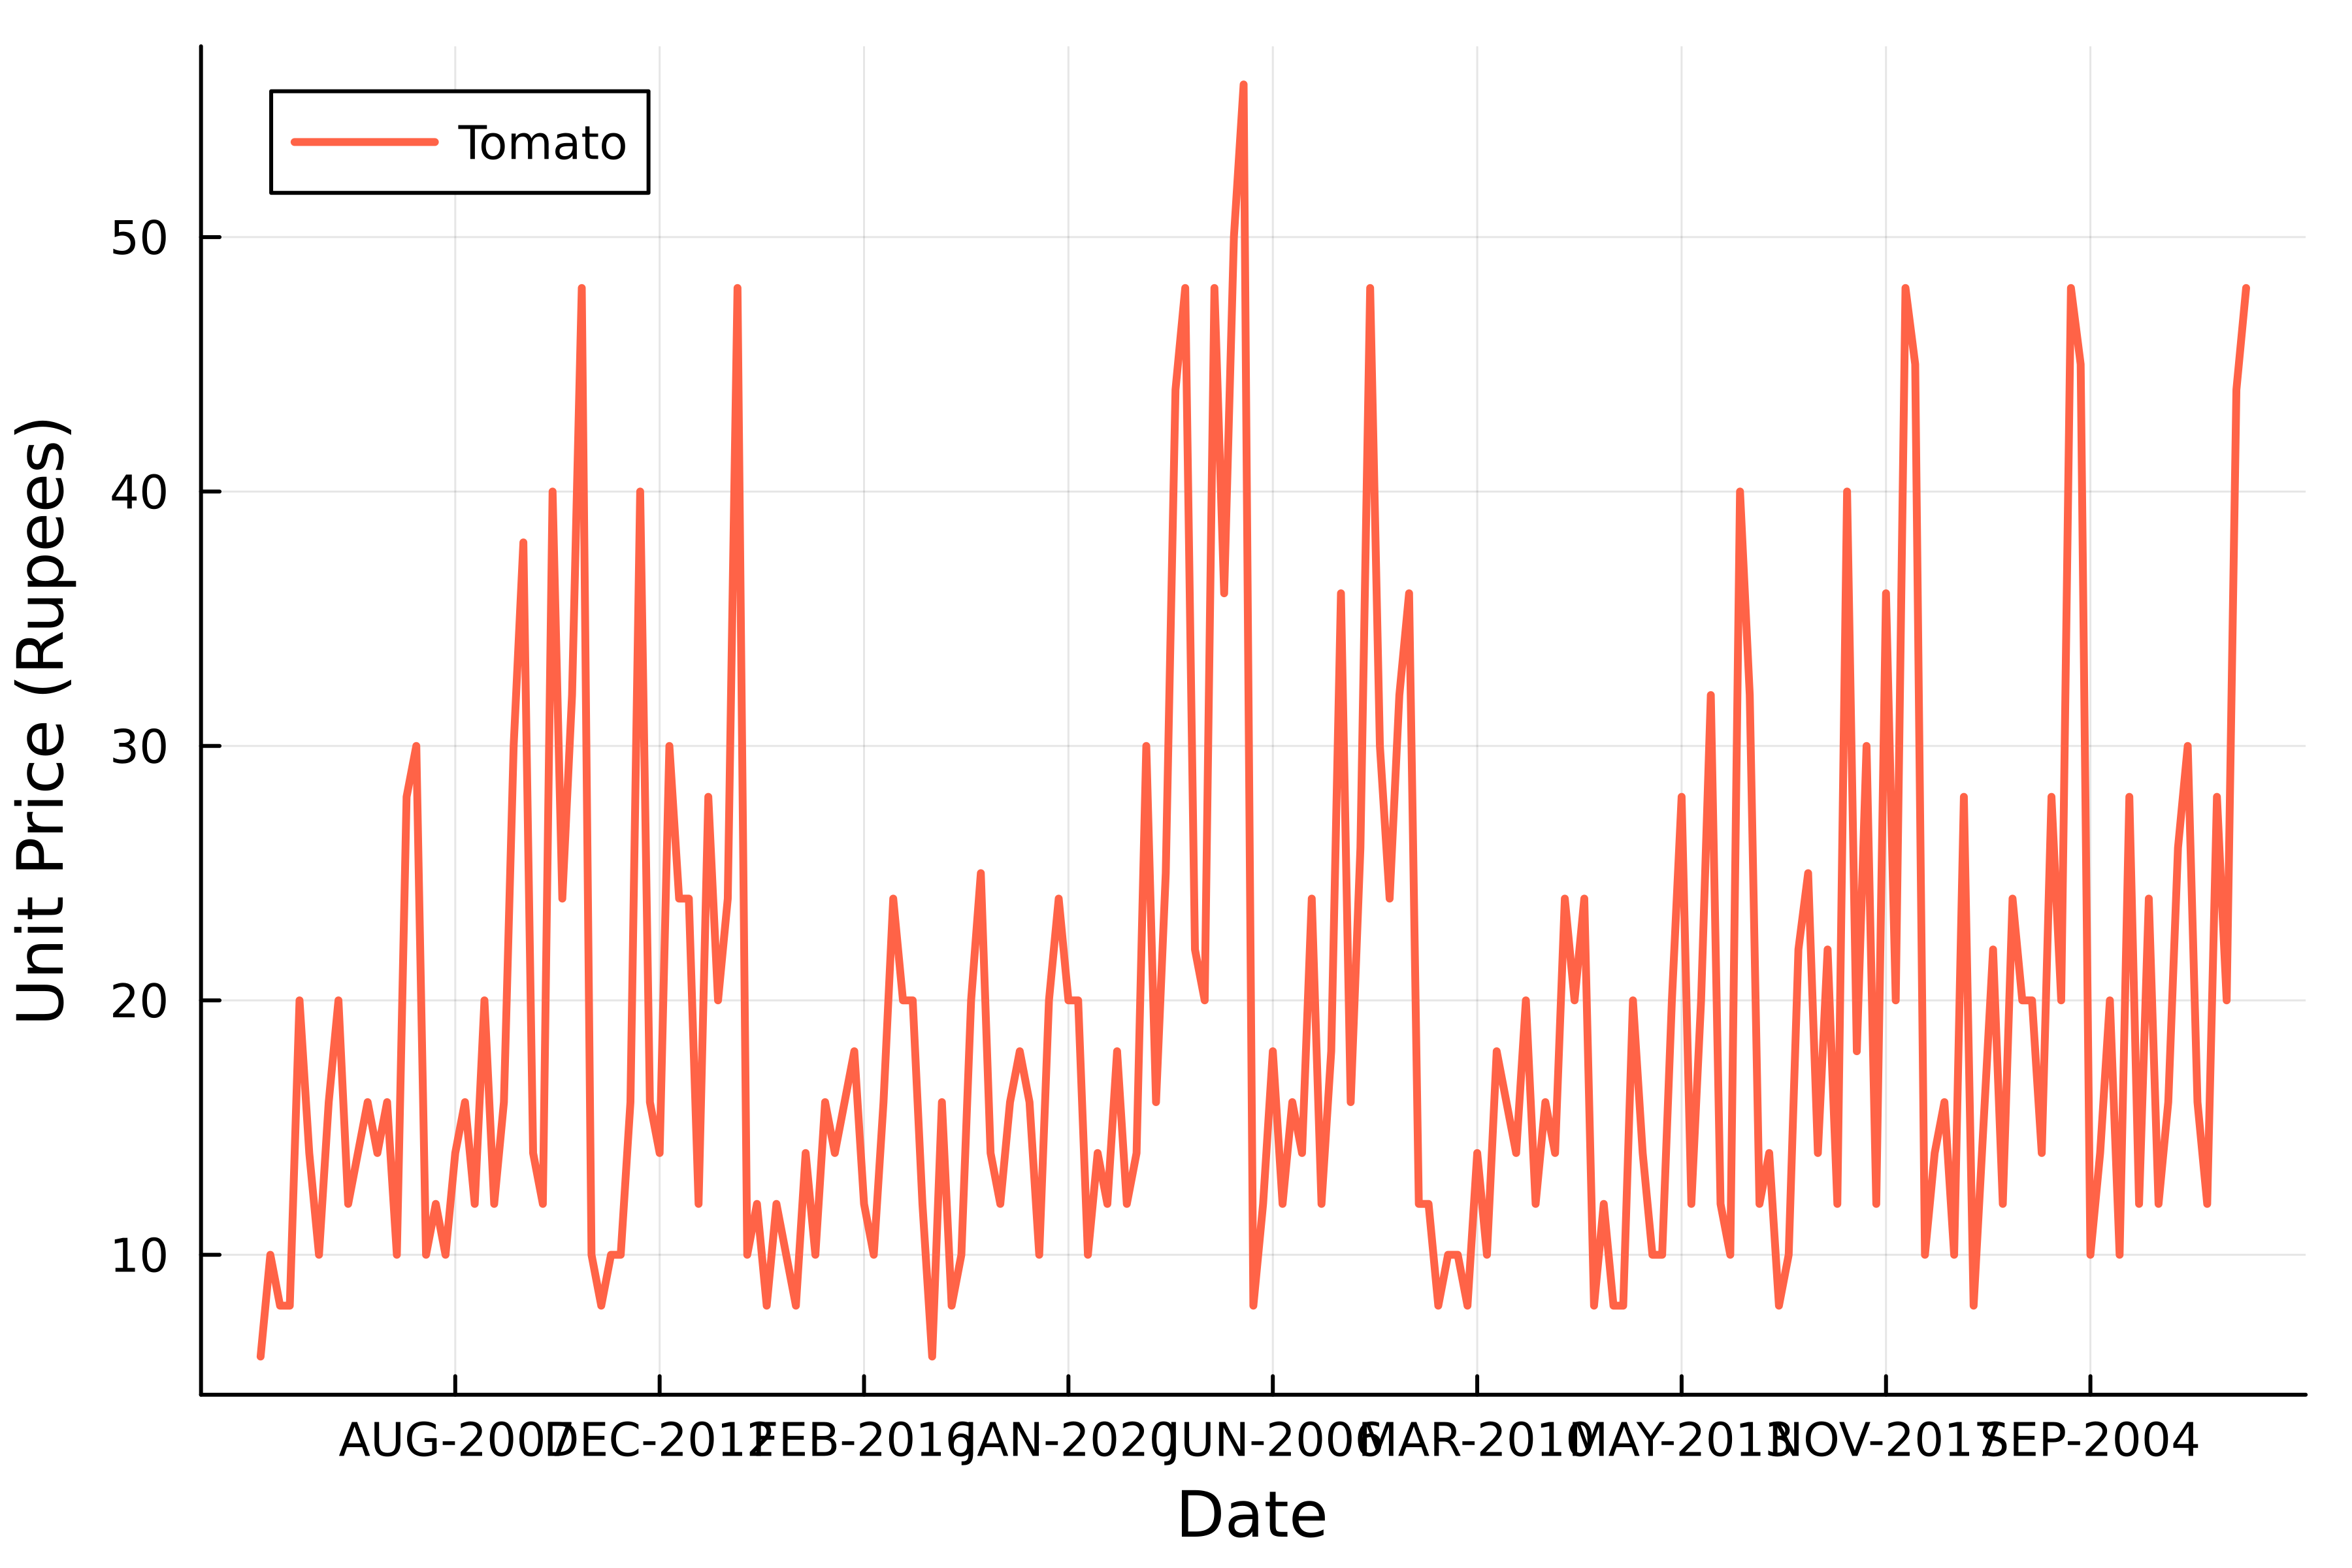
Tijdreeks van tomatenprijzen
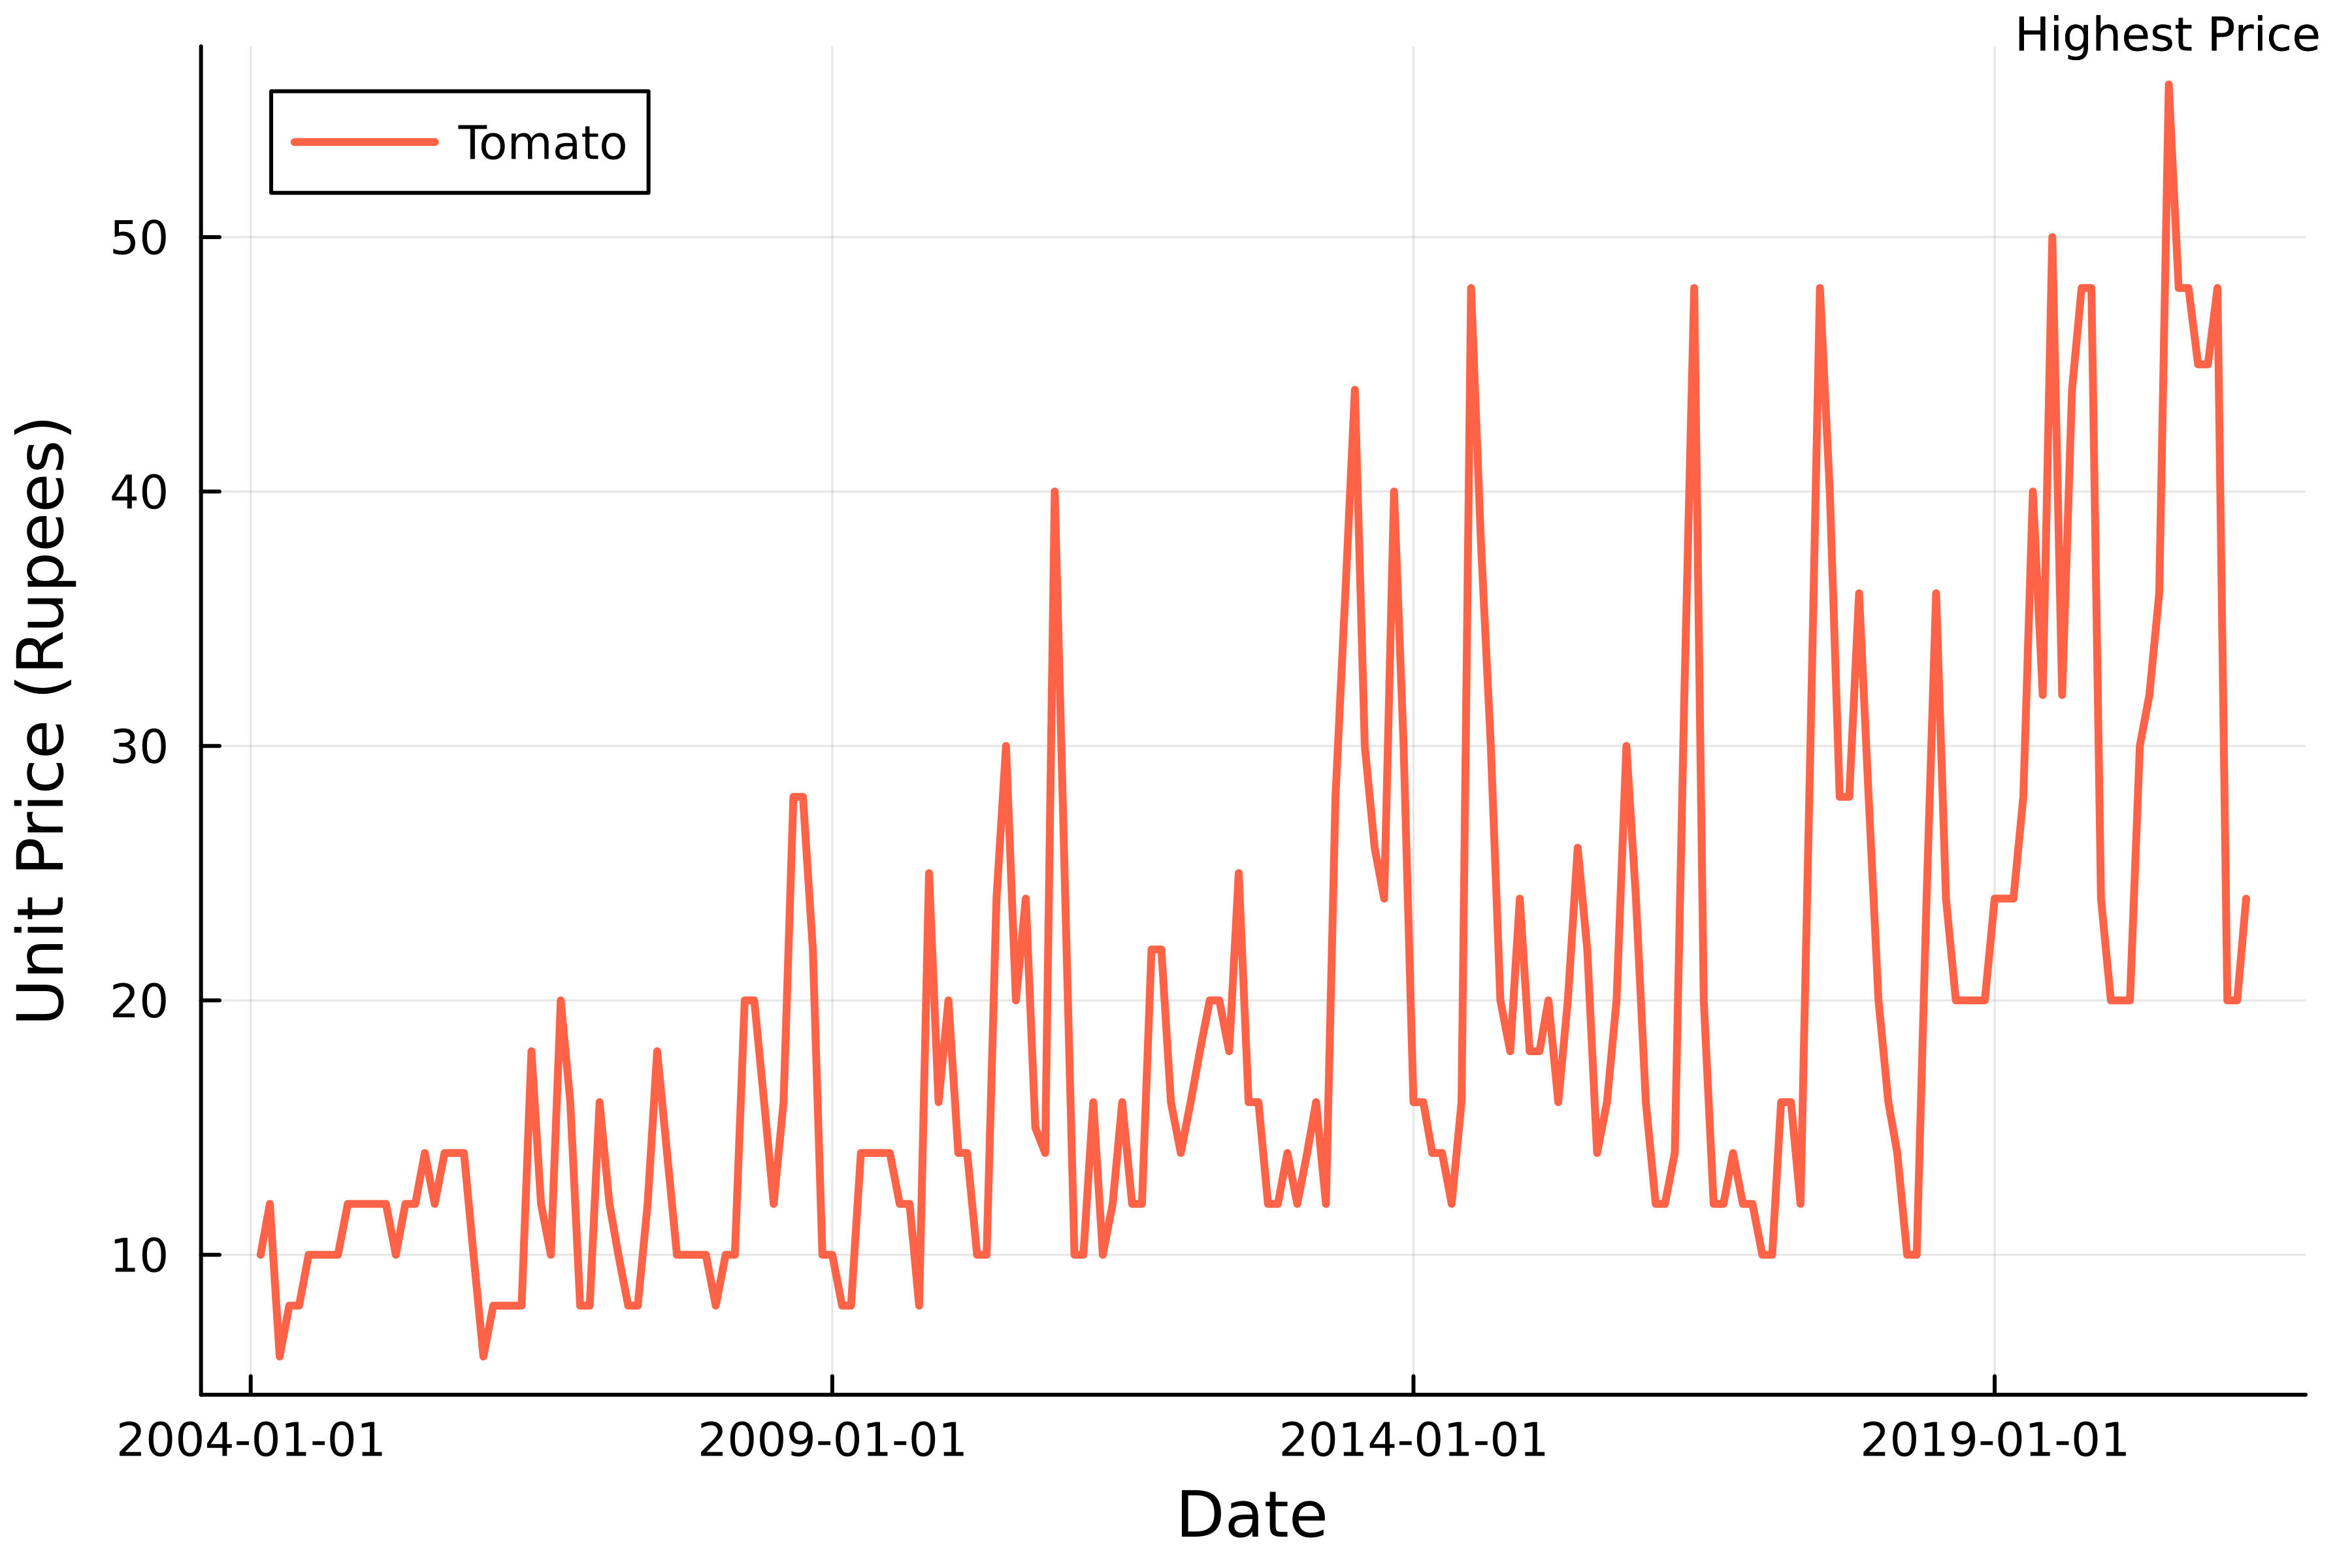
Een plot annoteren
Introductie tot datavisualisatie met Julia
Gustavo Vieira Suñe
Data Analyst

