Distributies visualiseren
Introductie tot datavisualisatie met Julia

Gustavo Vieira Suñe
Data Analyst
Distributies visualiseren met histogrammen
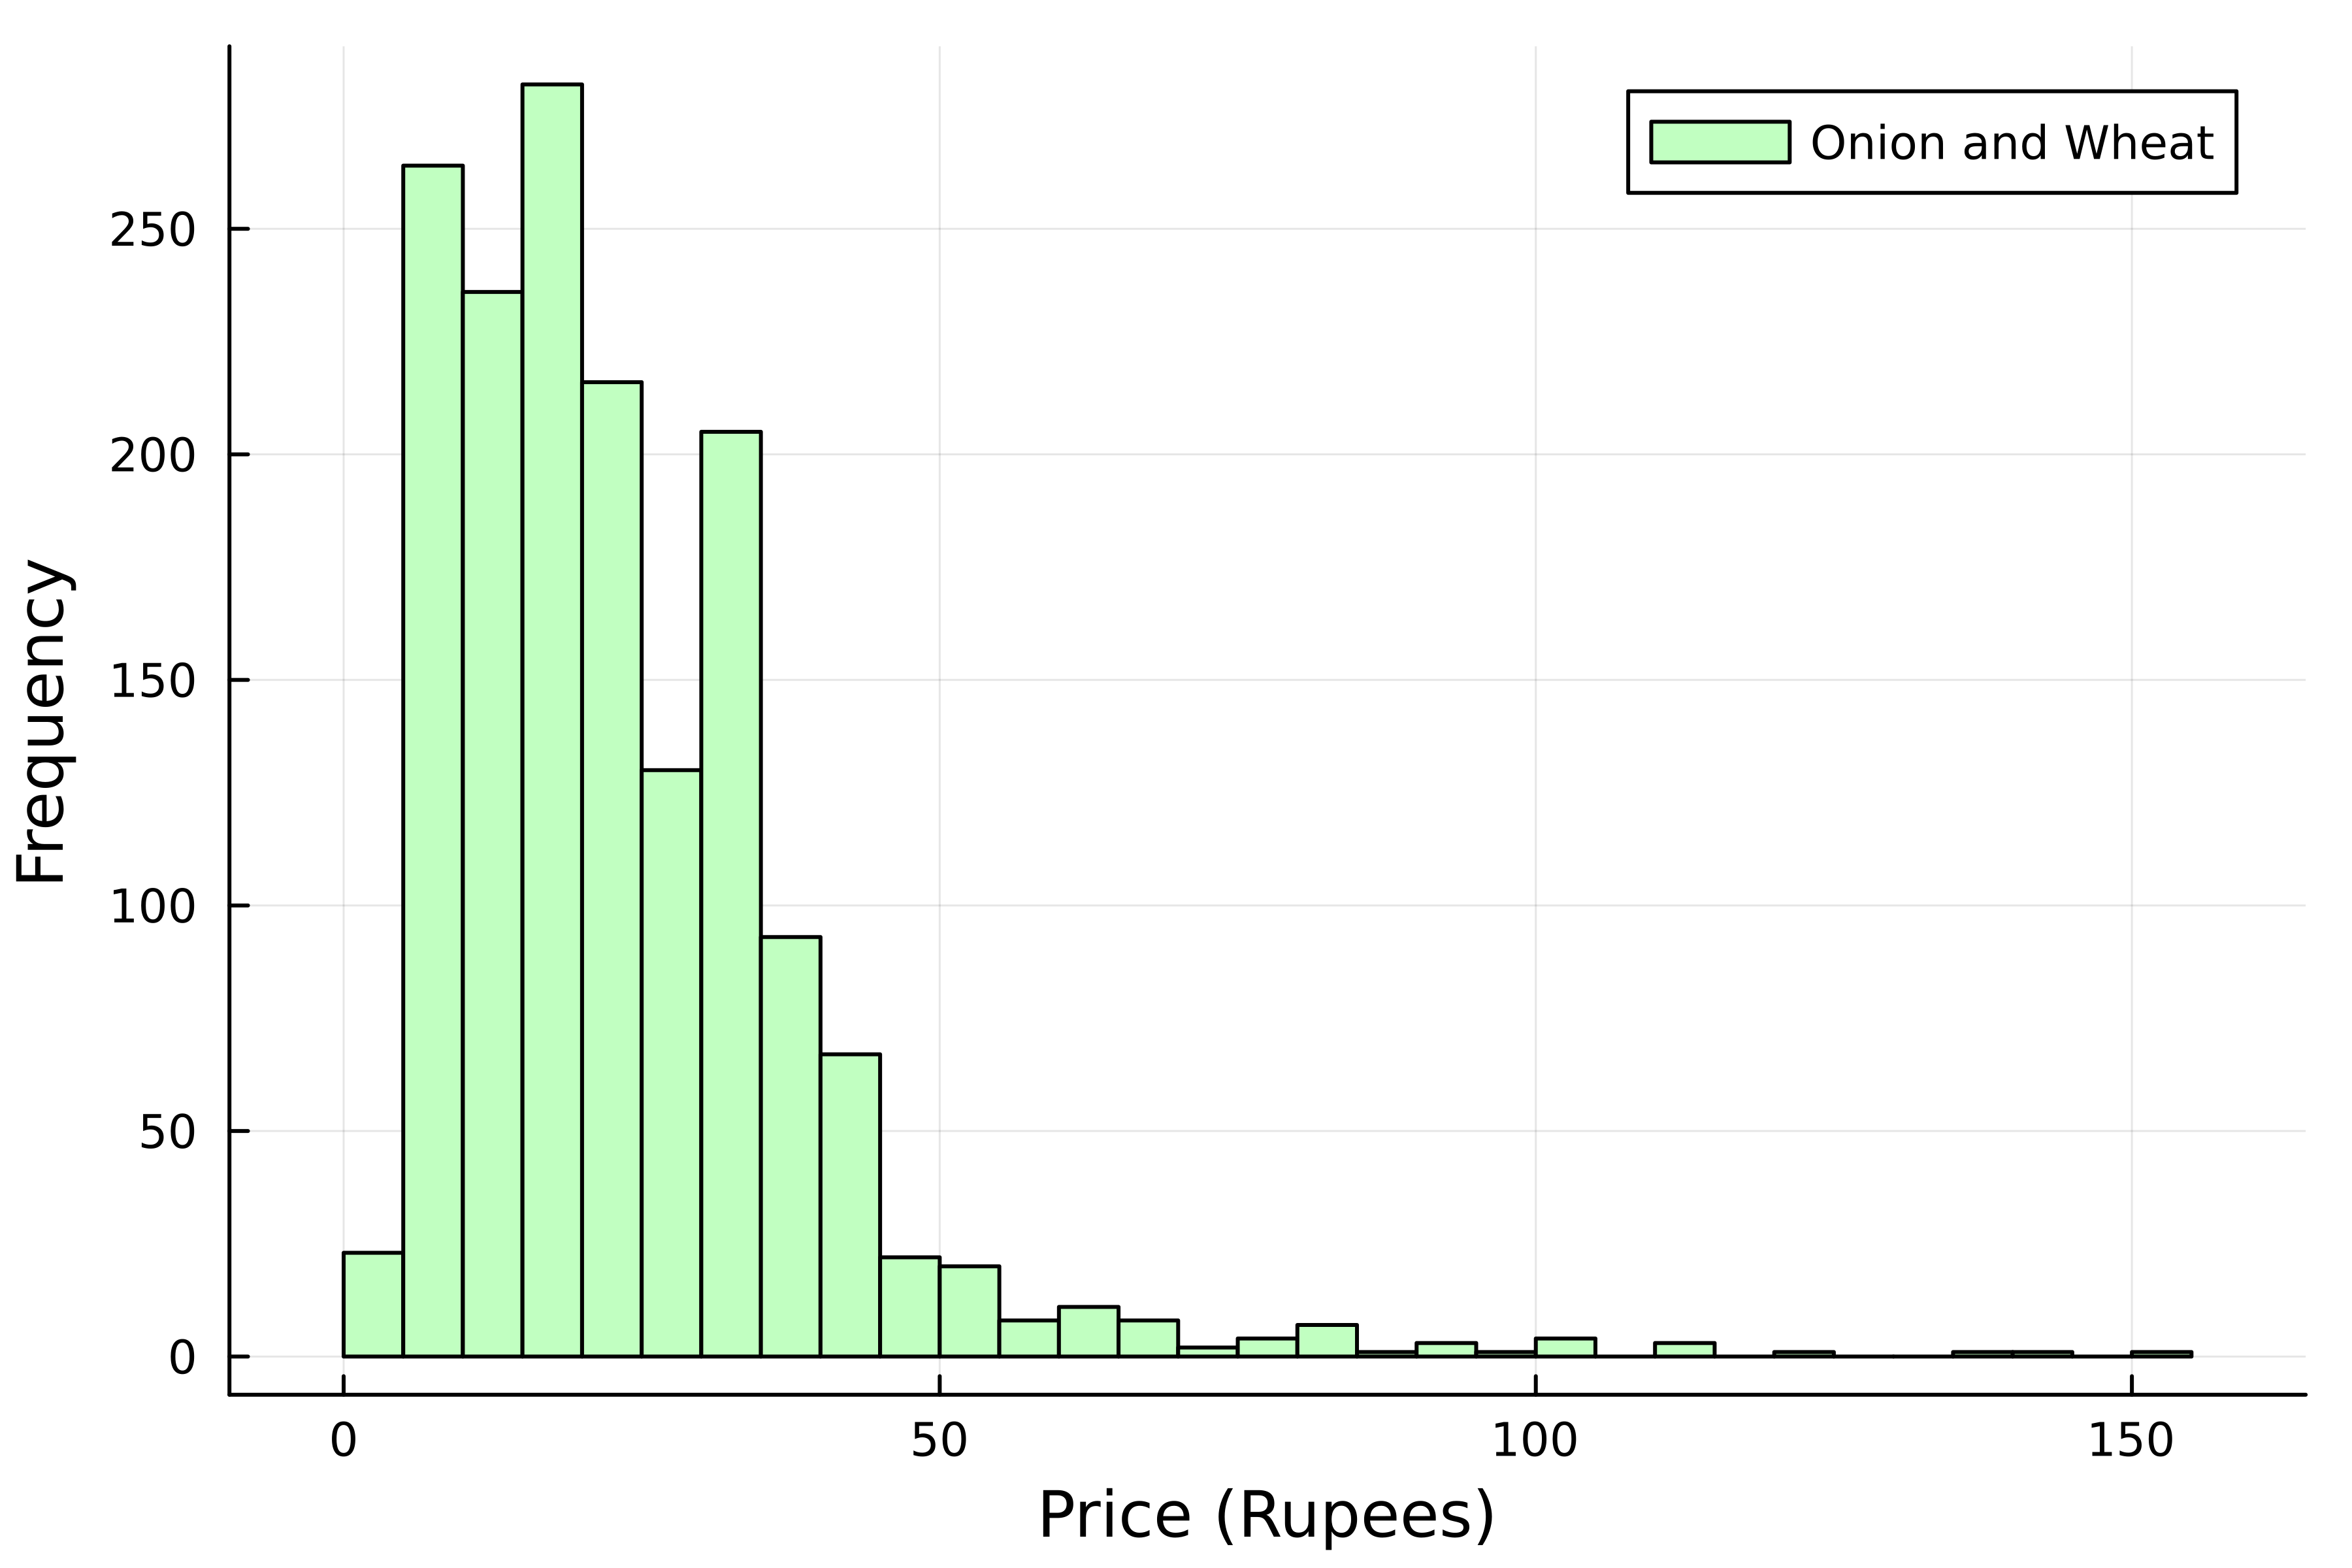
Verdeling van uien- en tarweprijzen
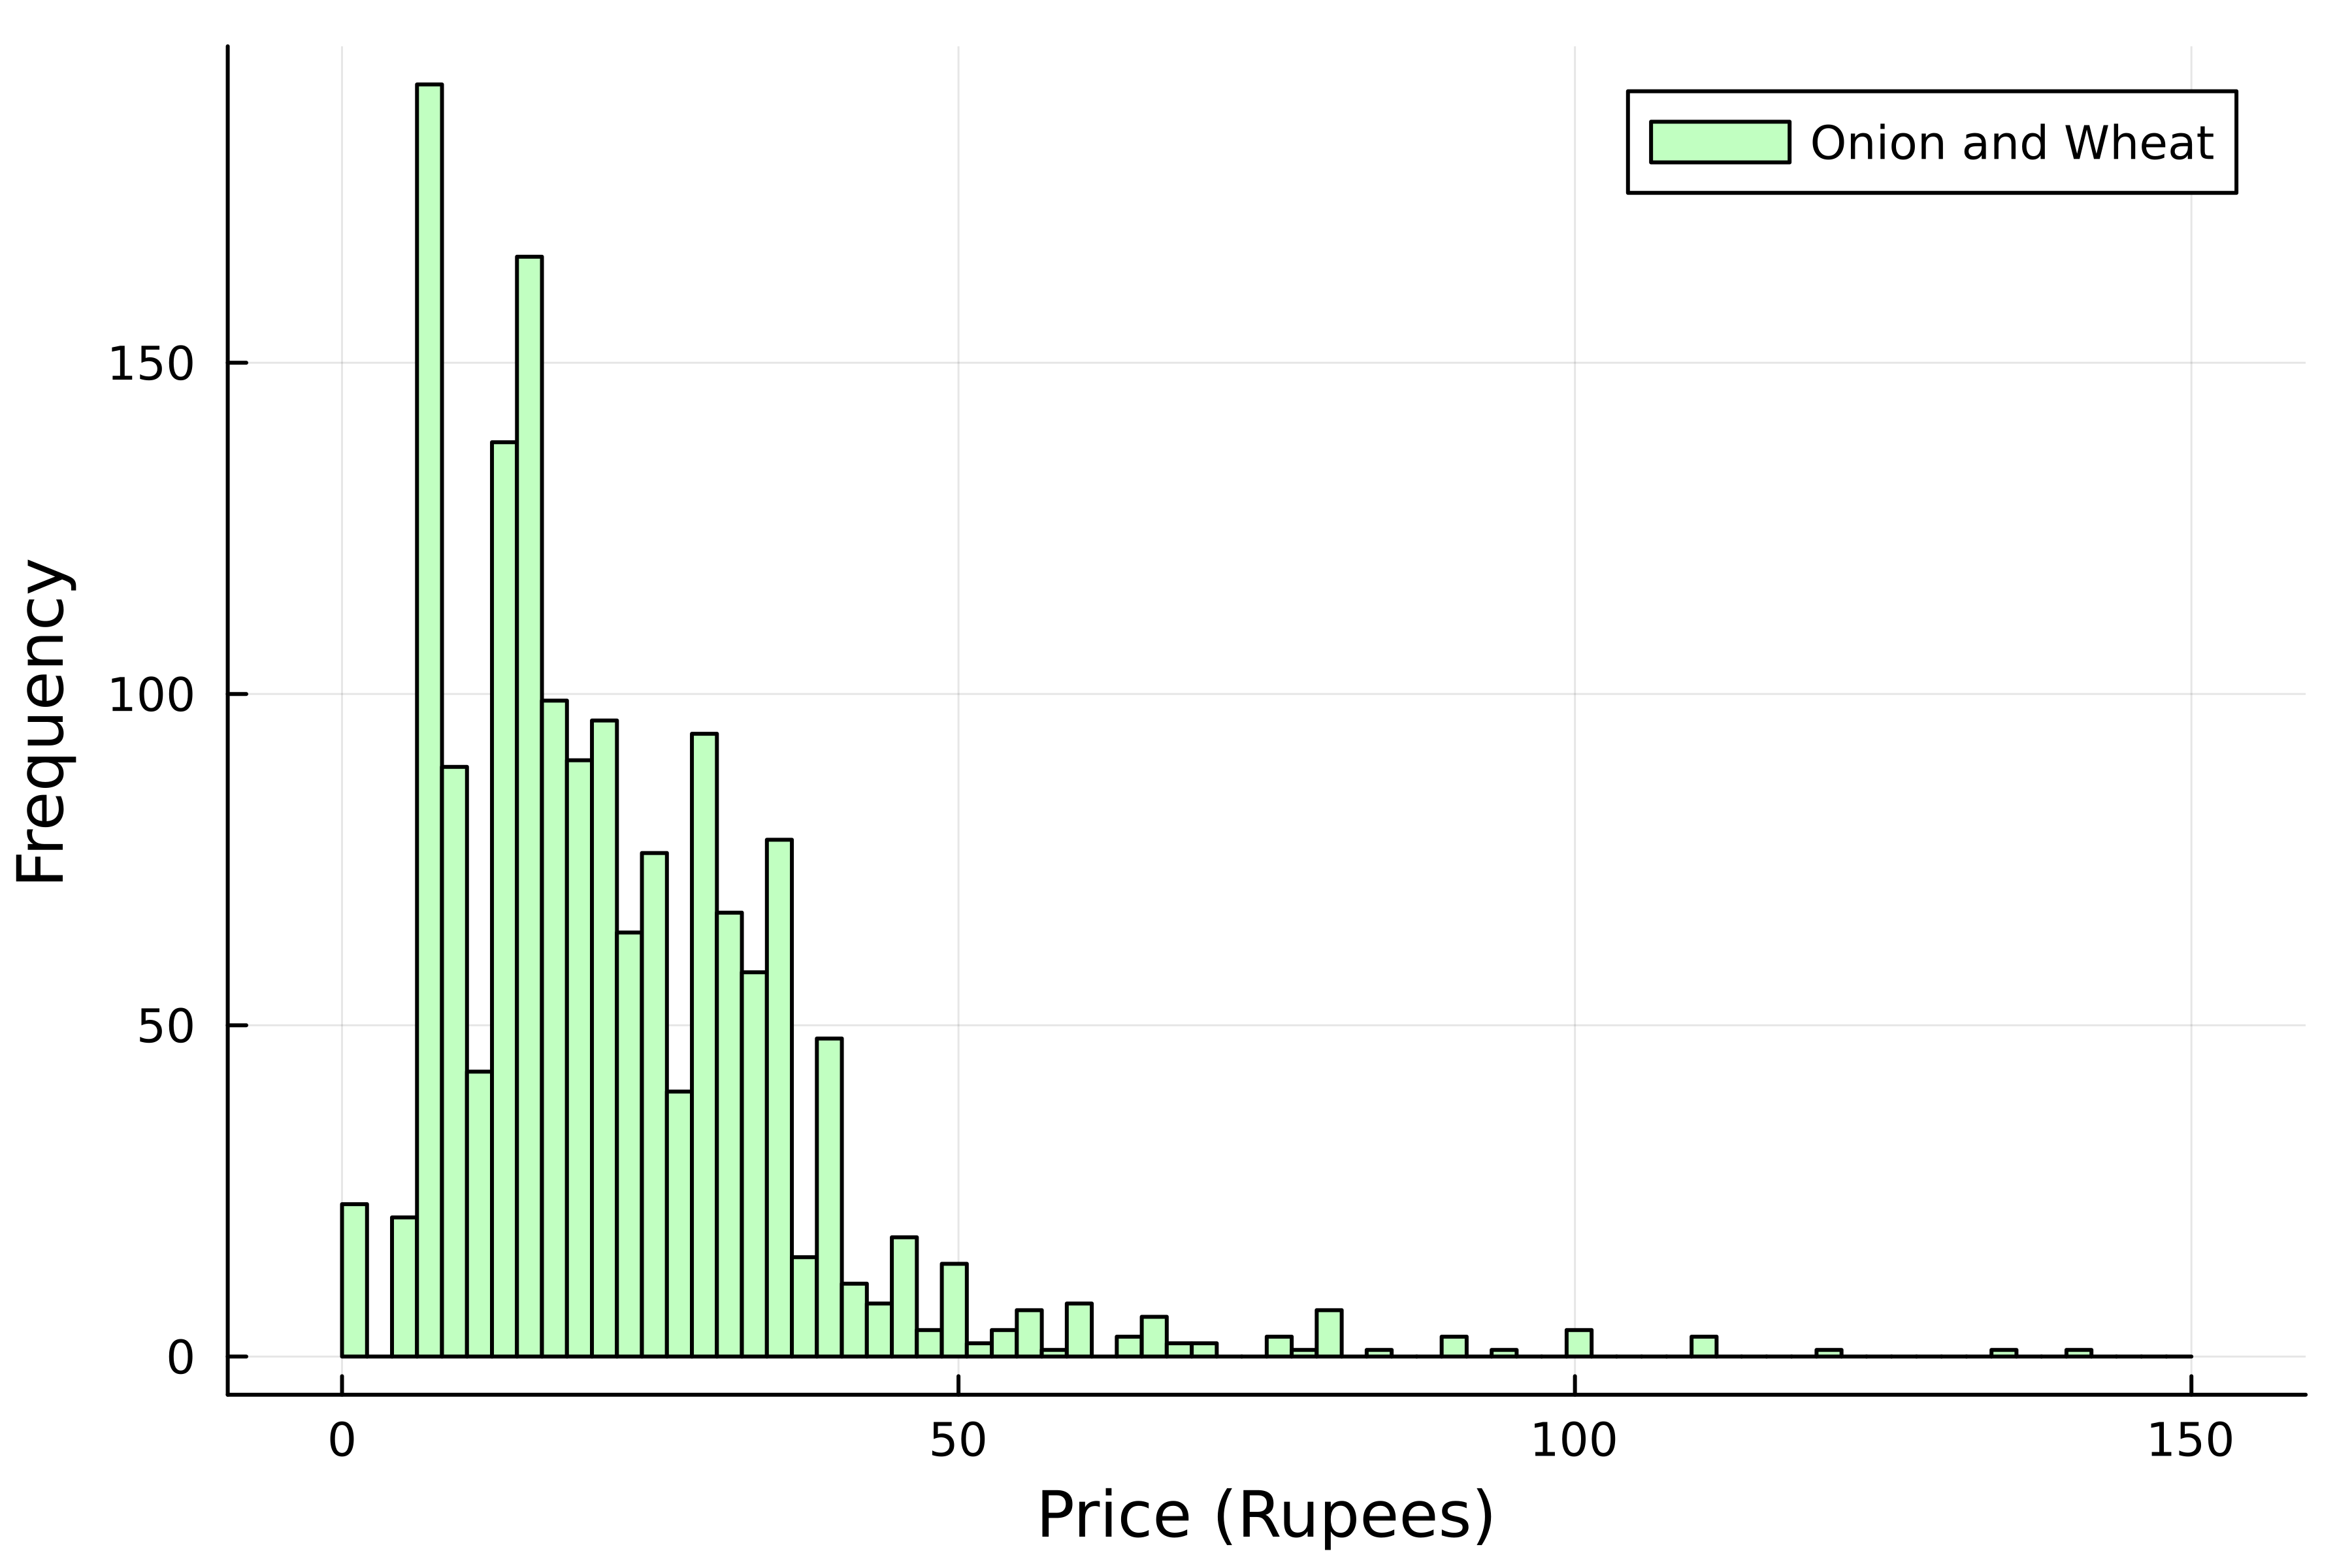
Aantal bins
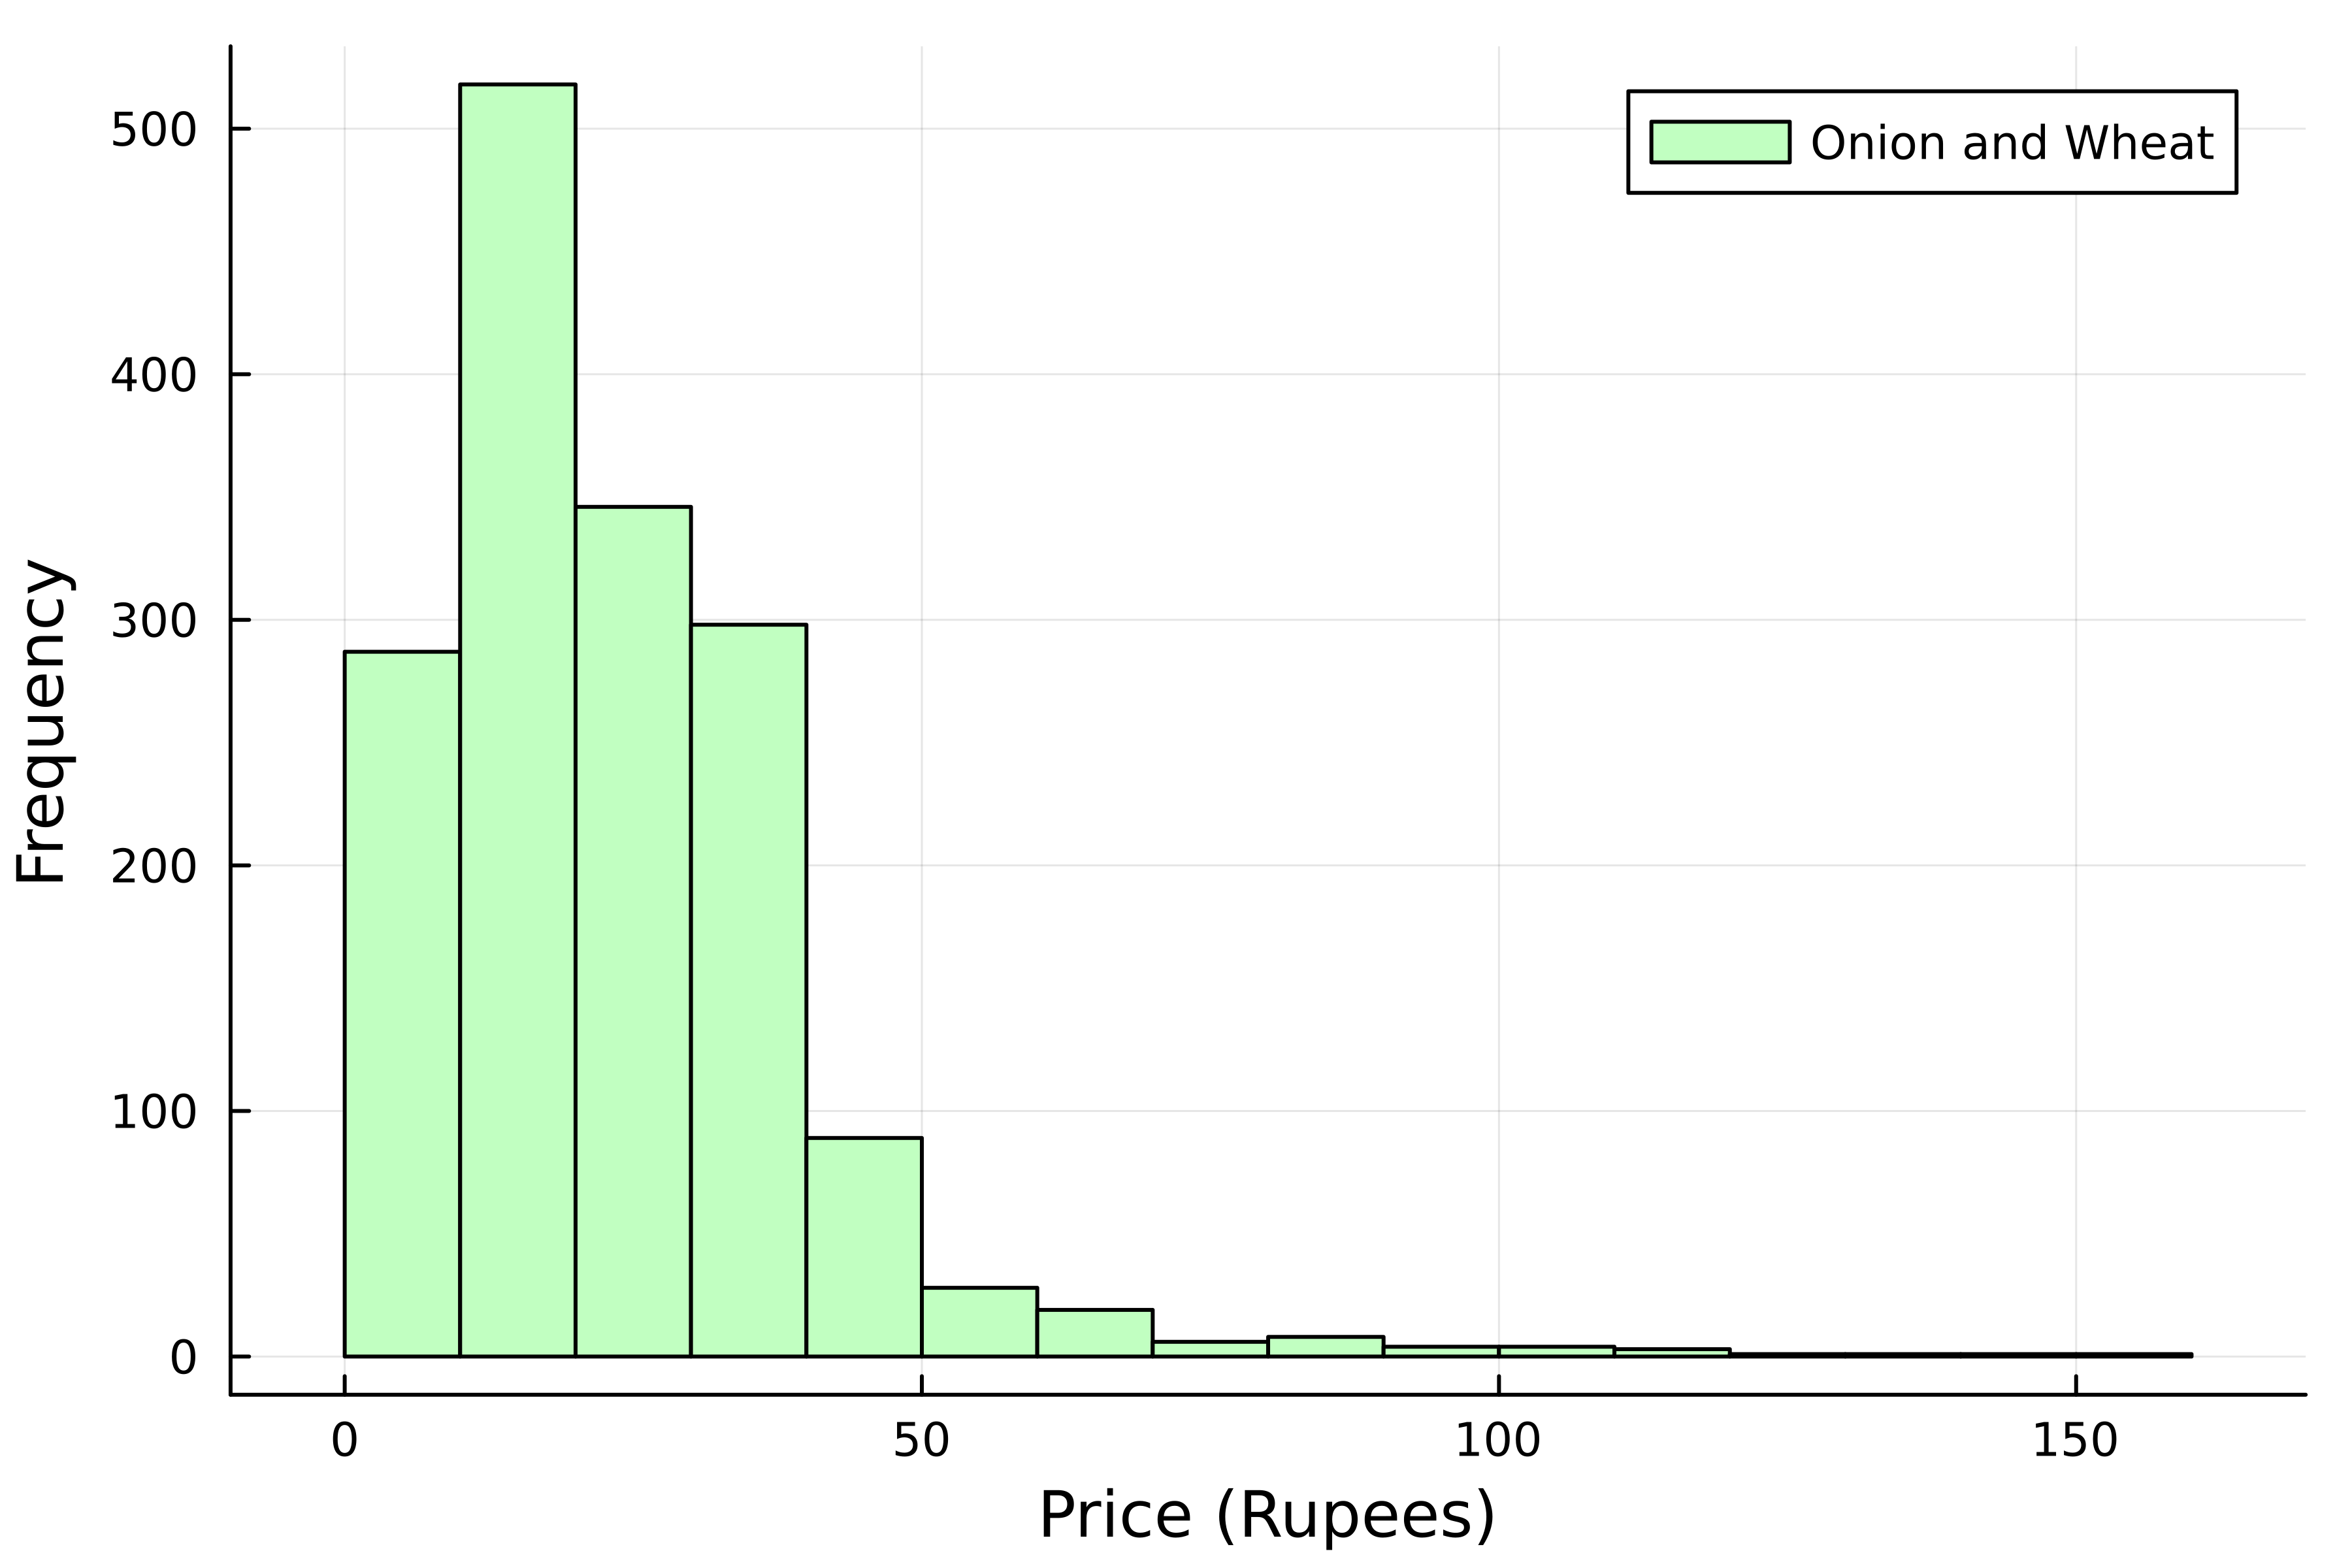
Aantal bins
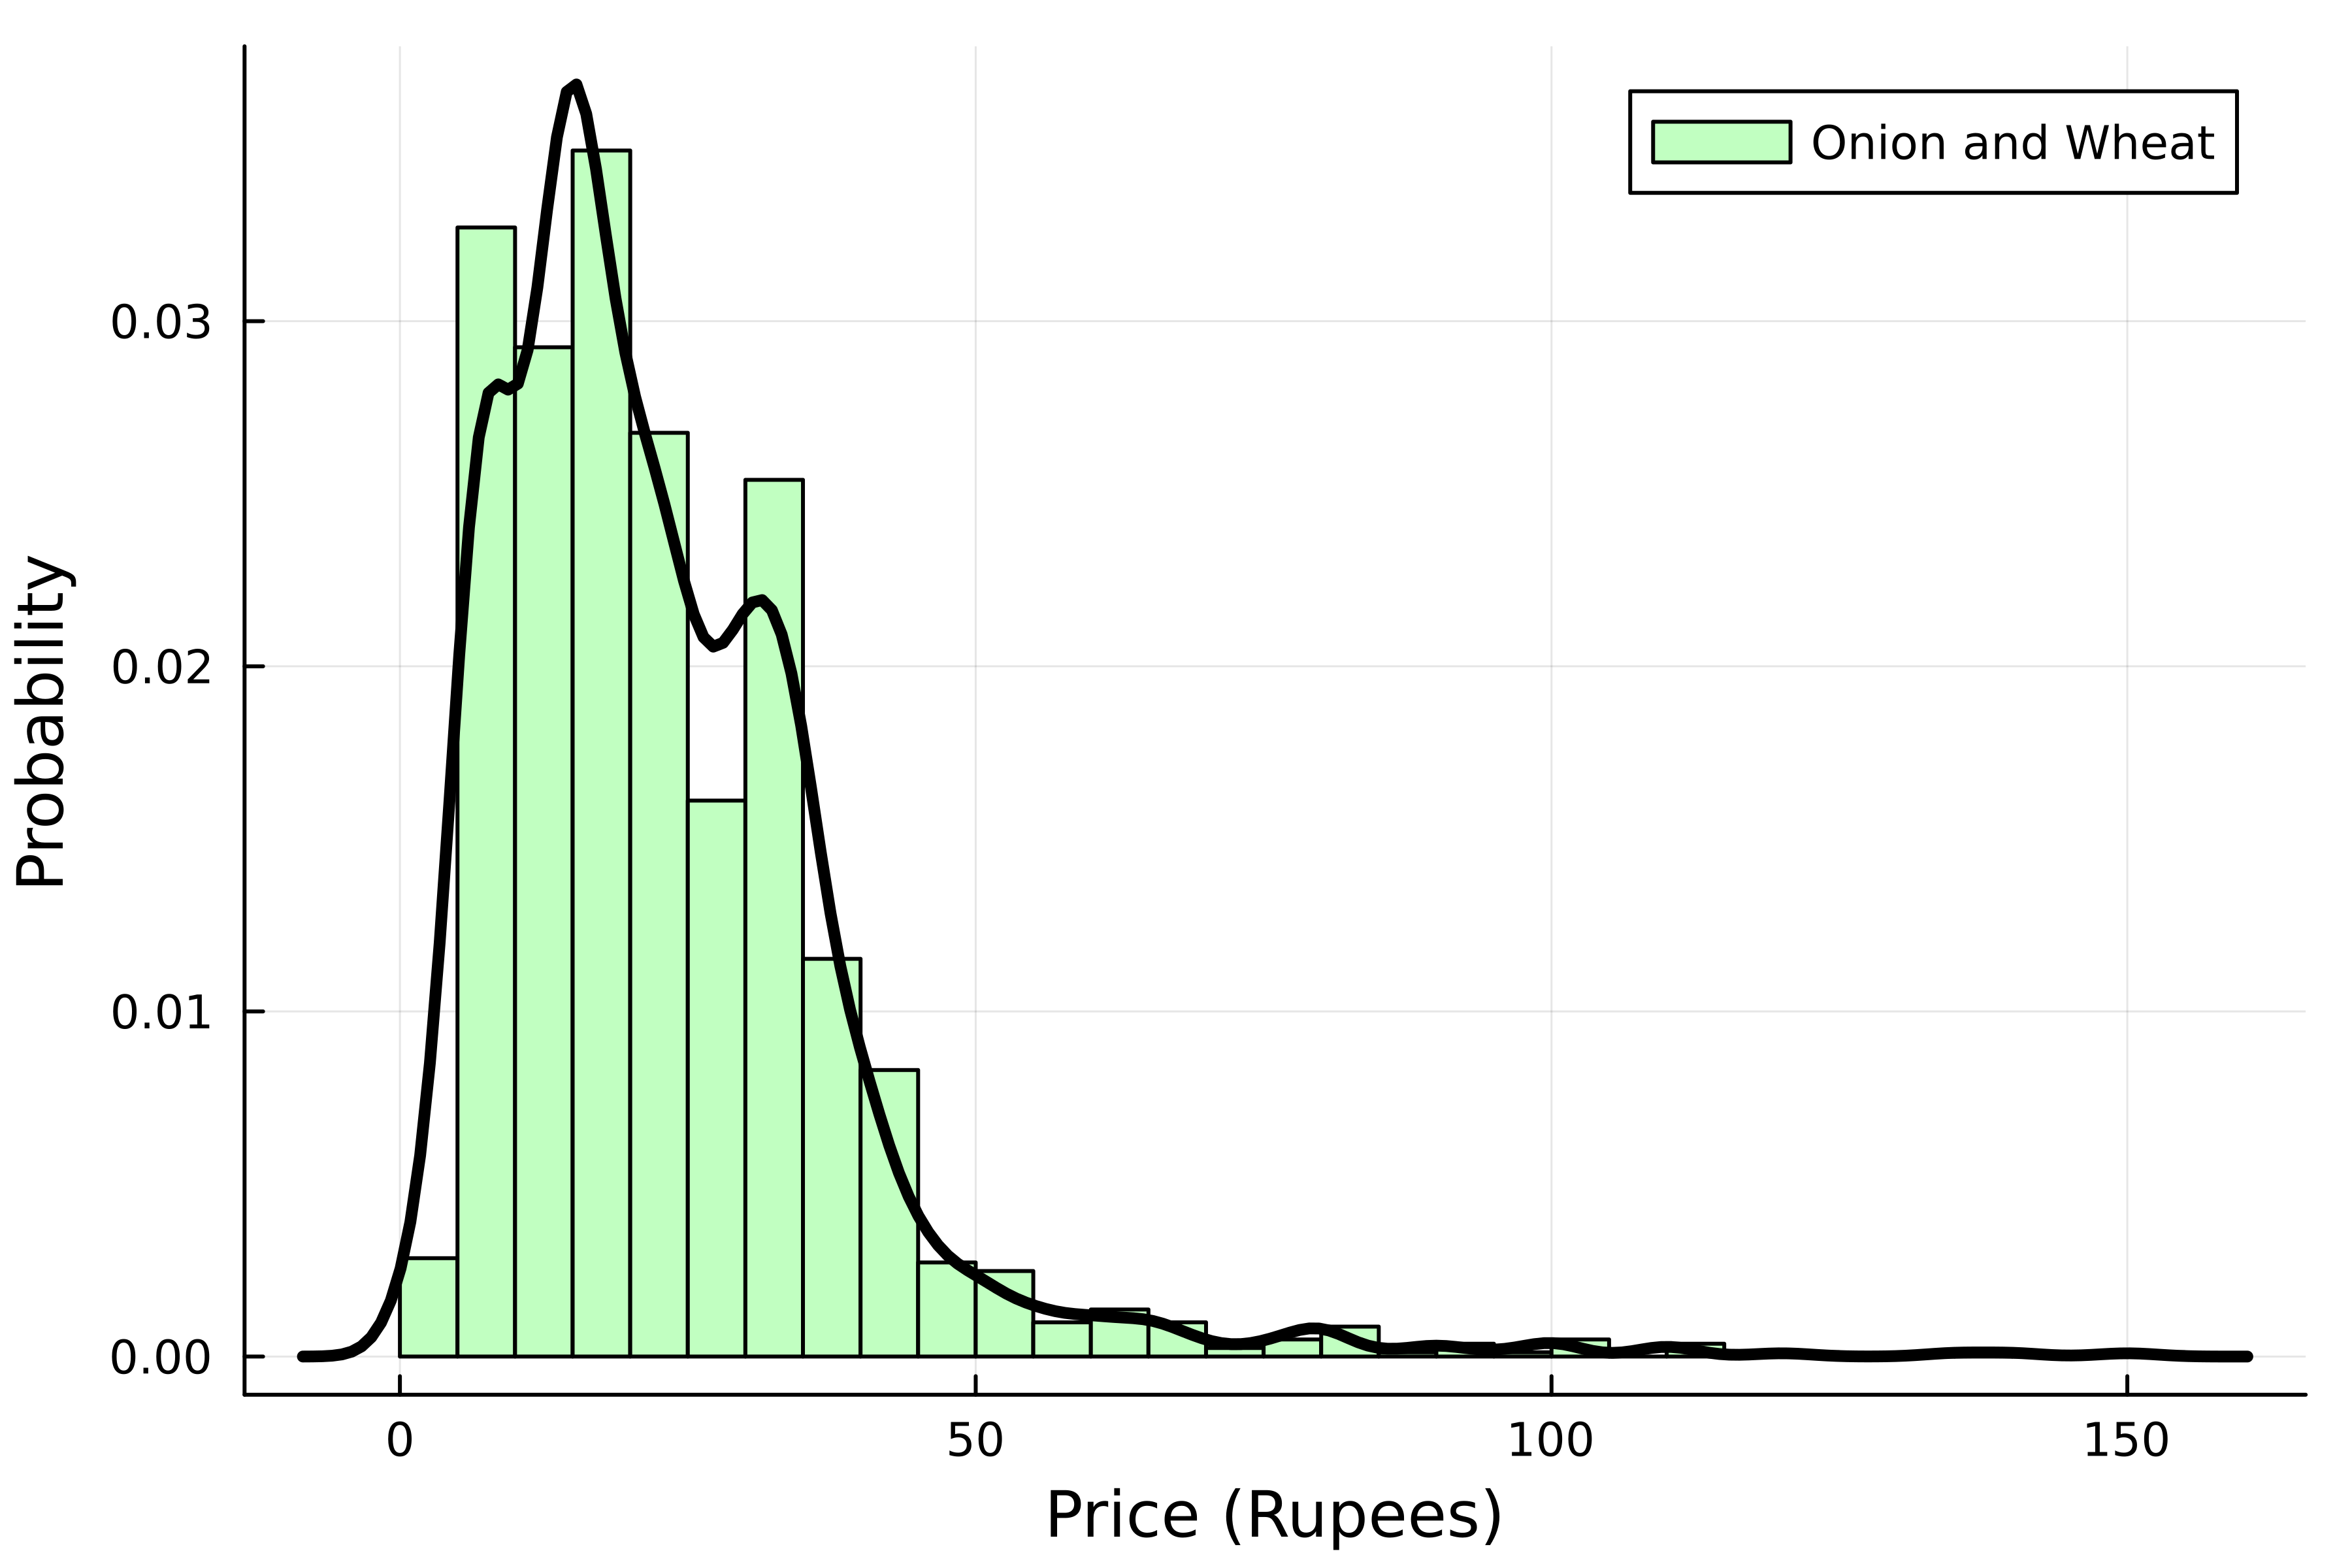
Genormaliseerd histogram
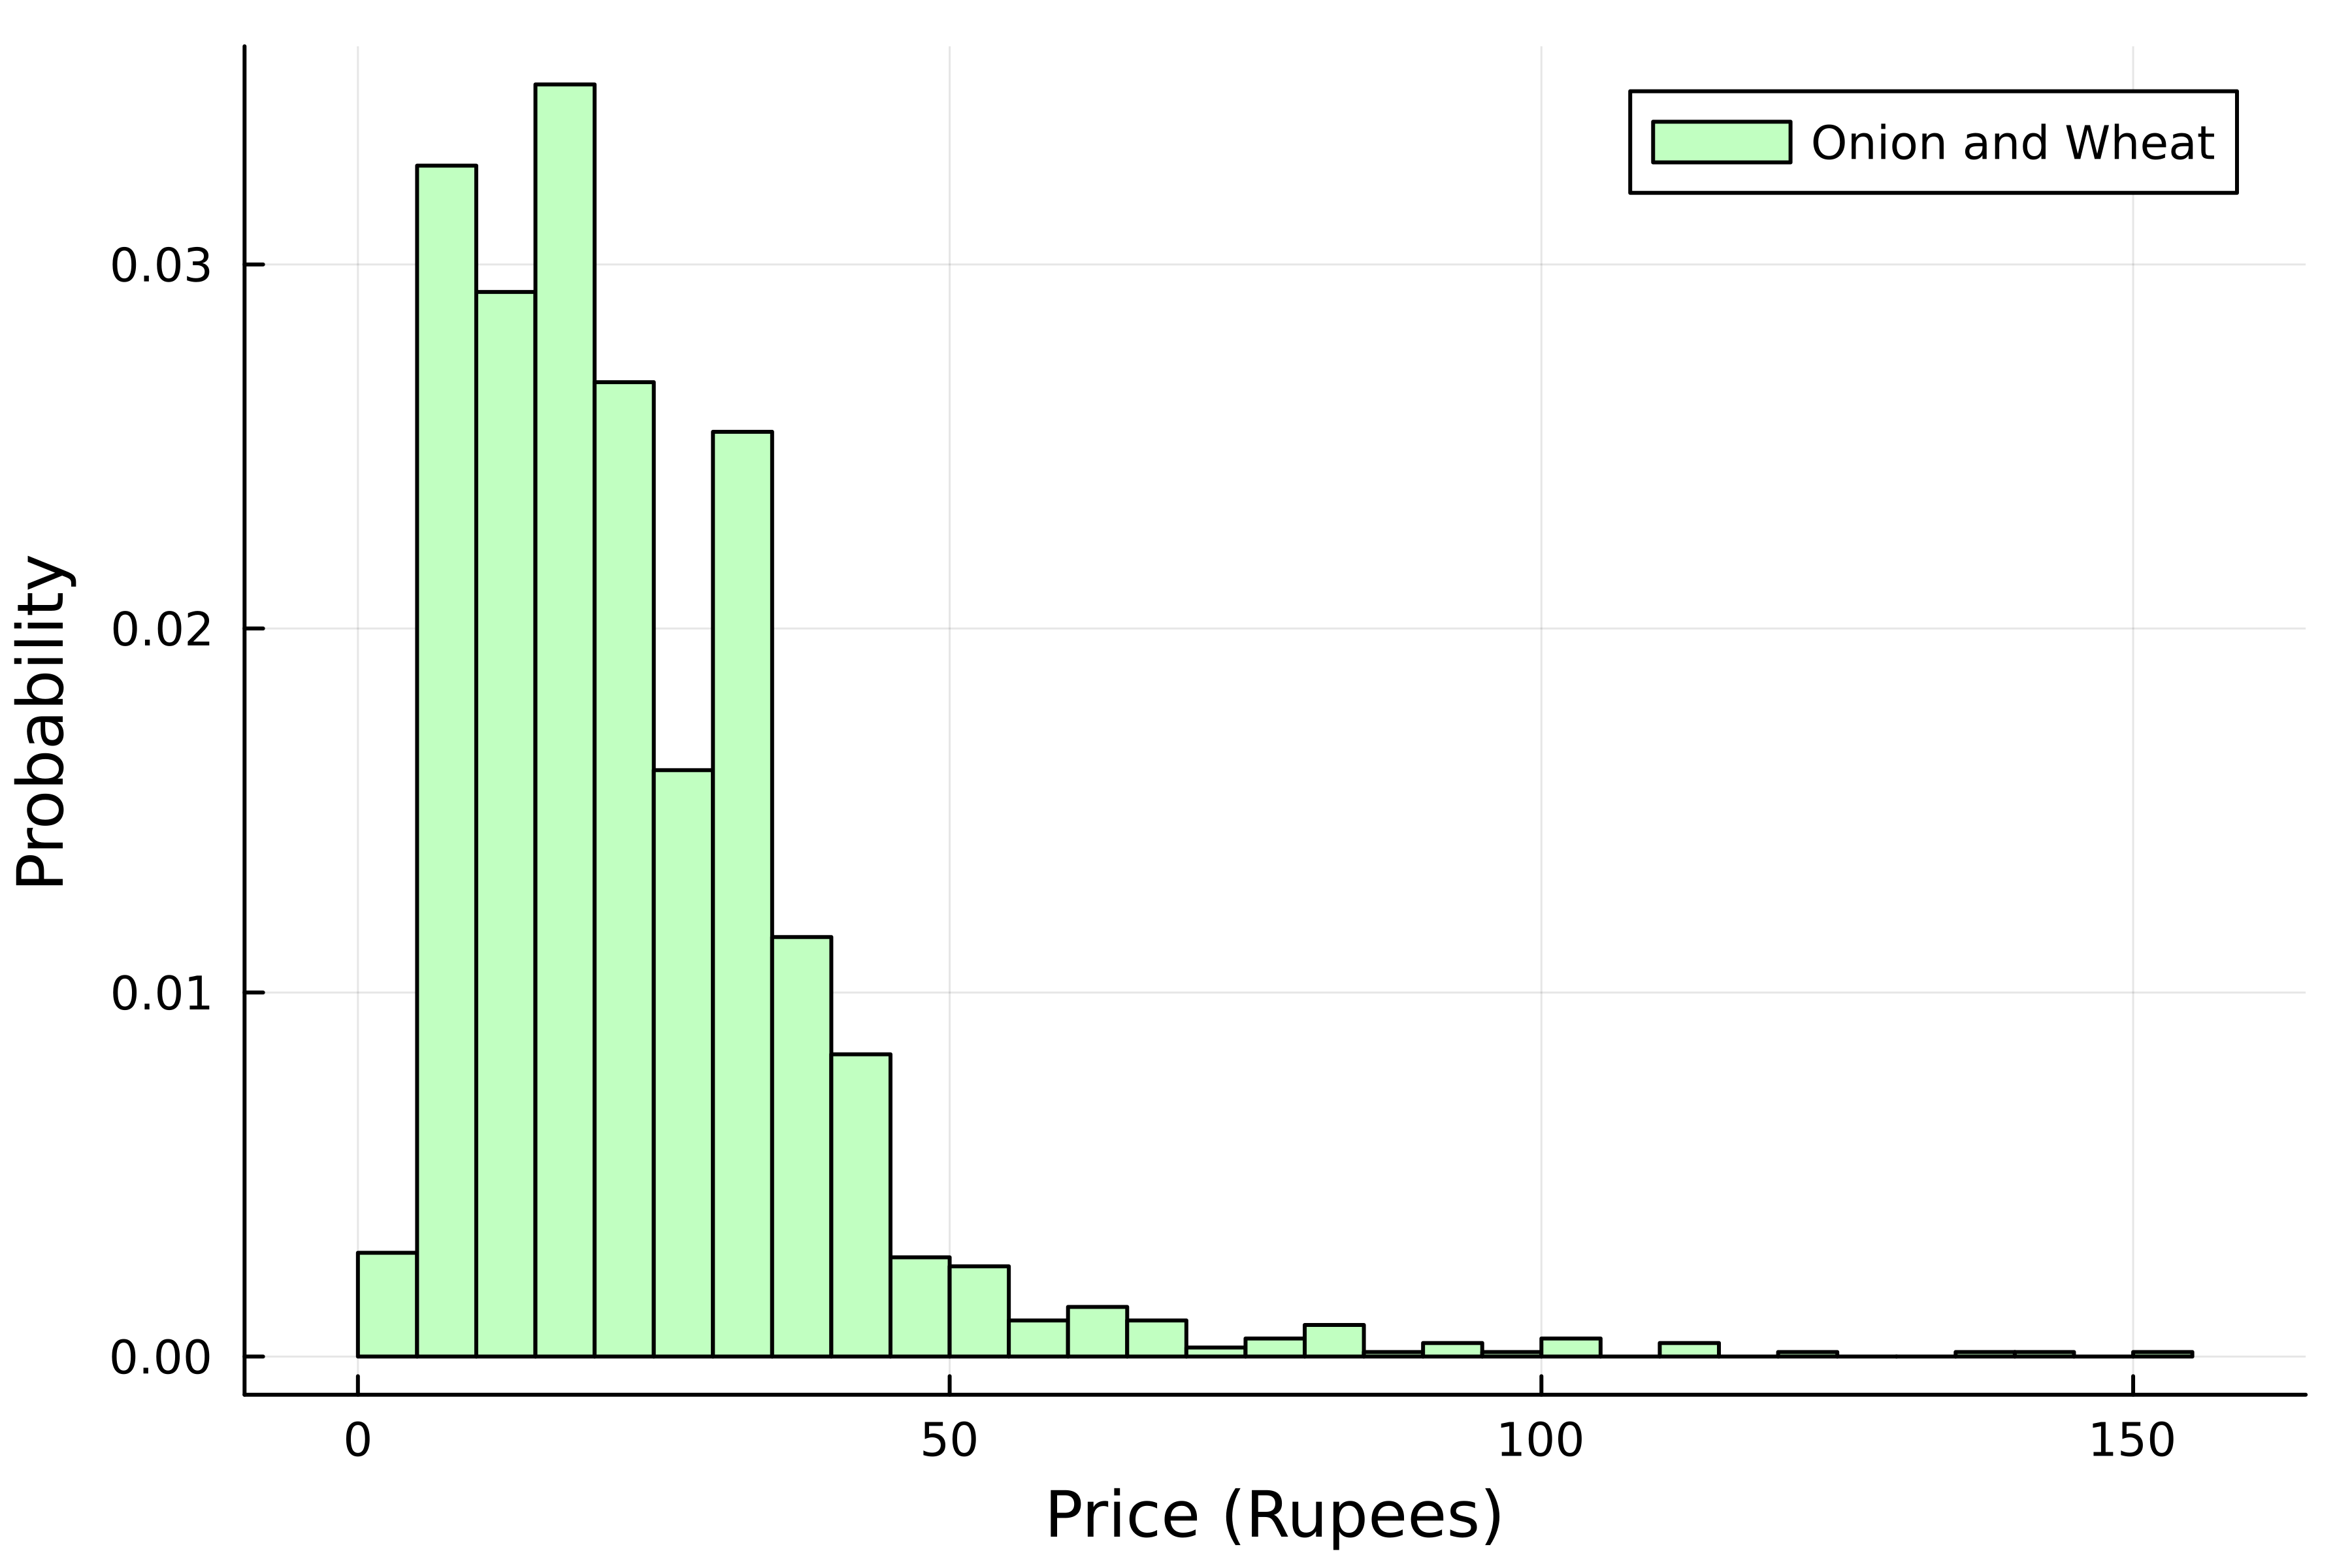
Kansverdeling
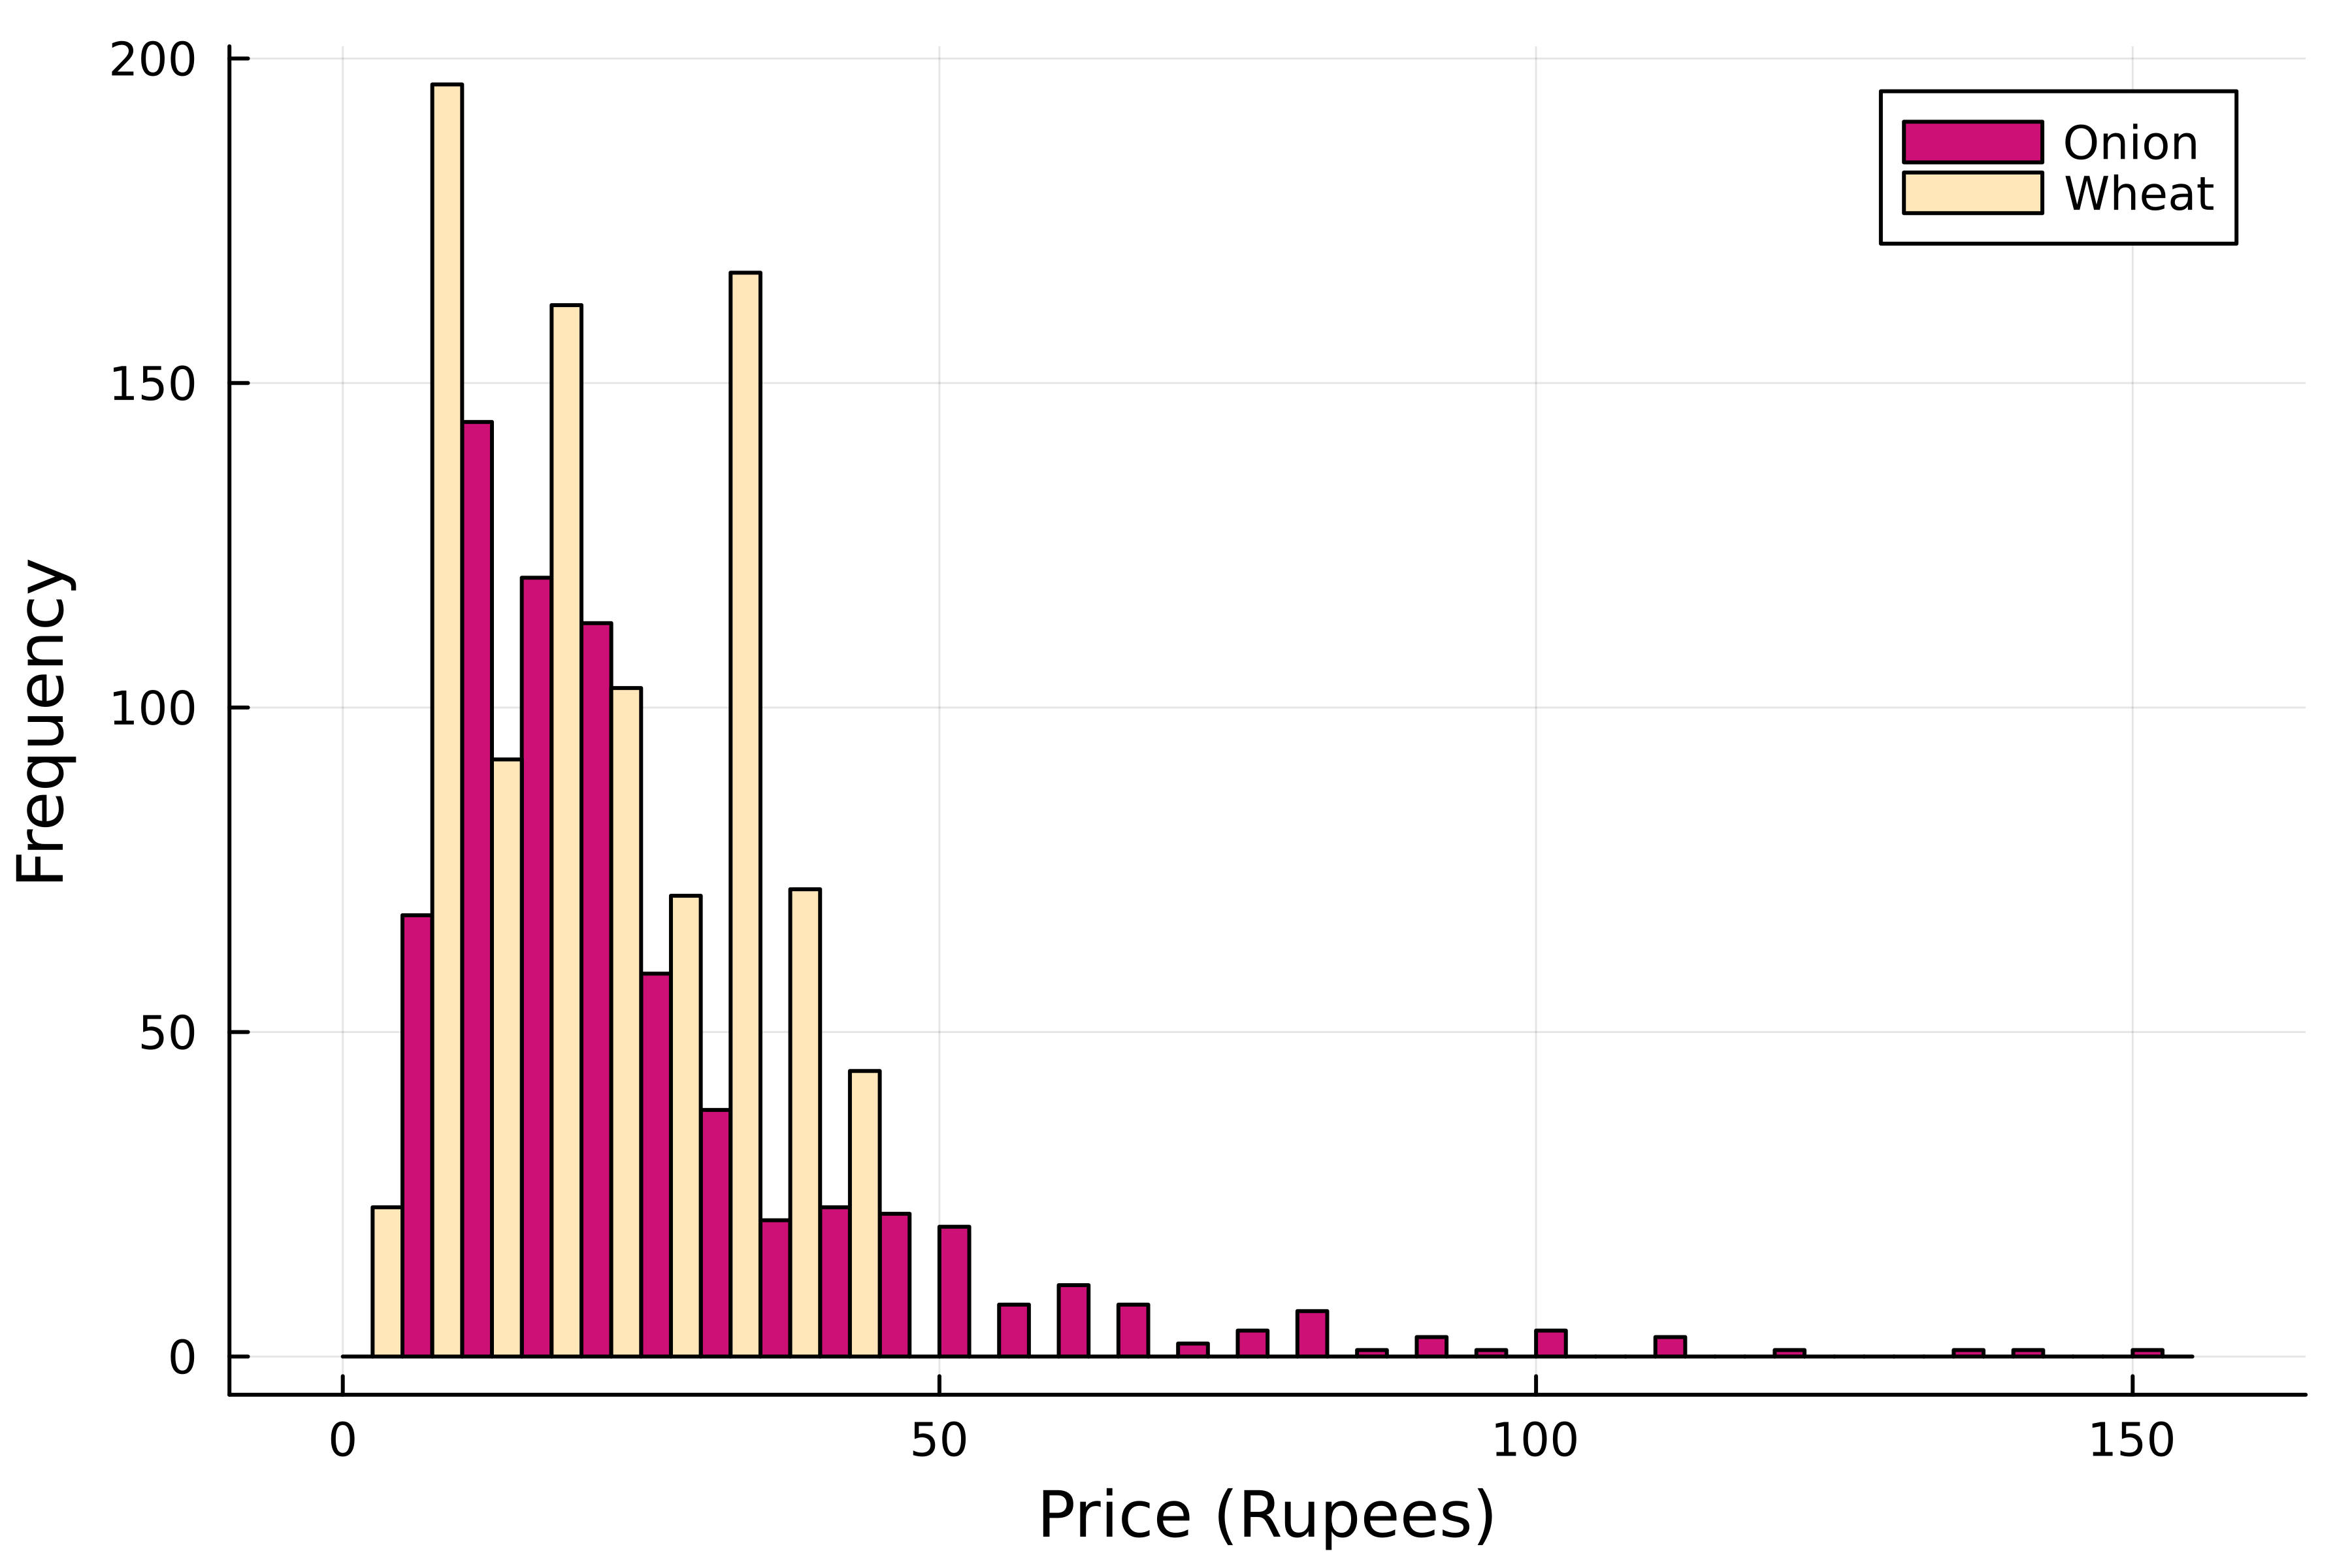
Prijzen per product
Gestapeld histogram
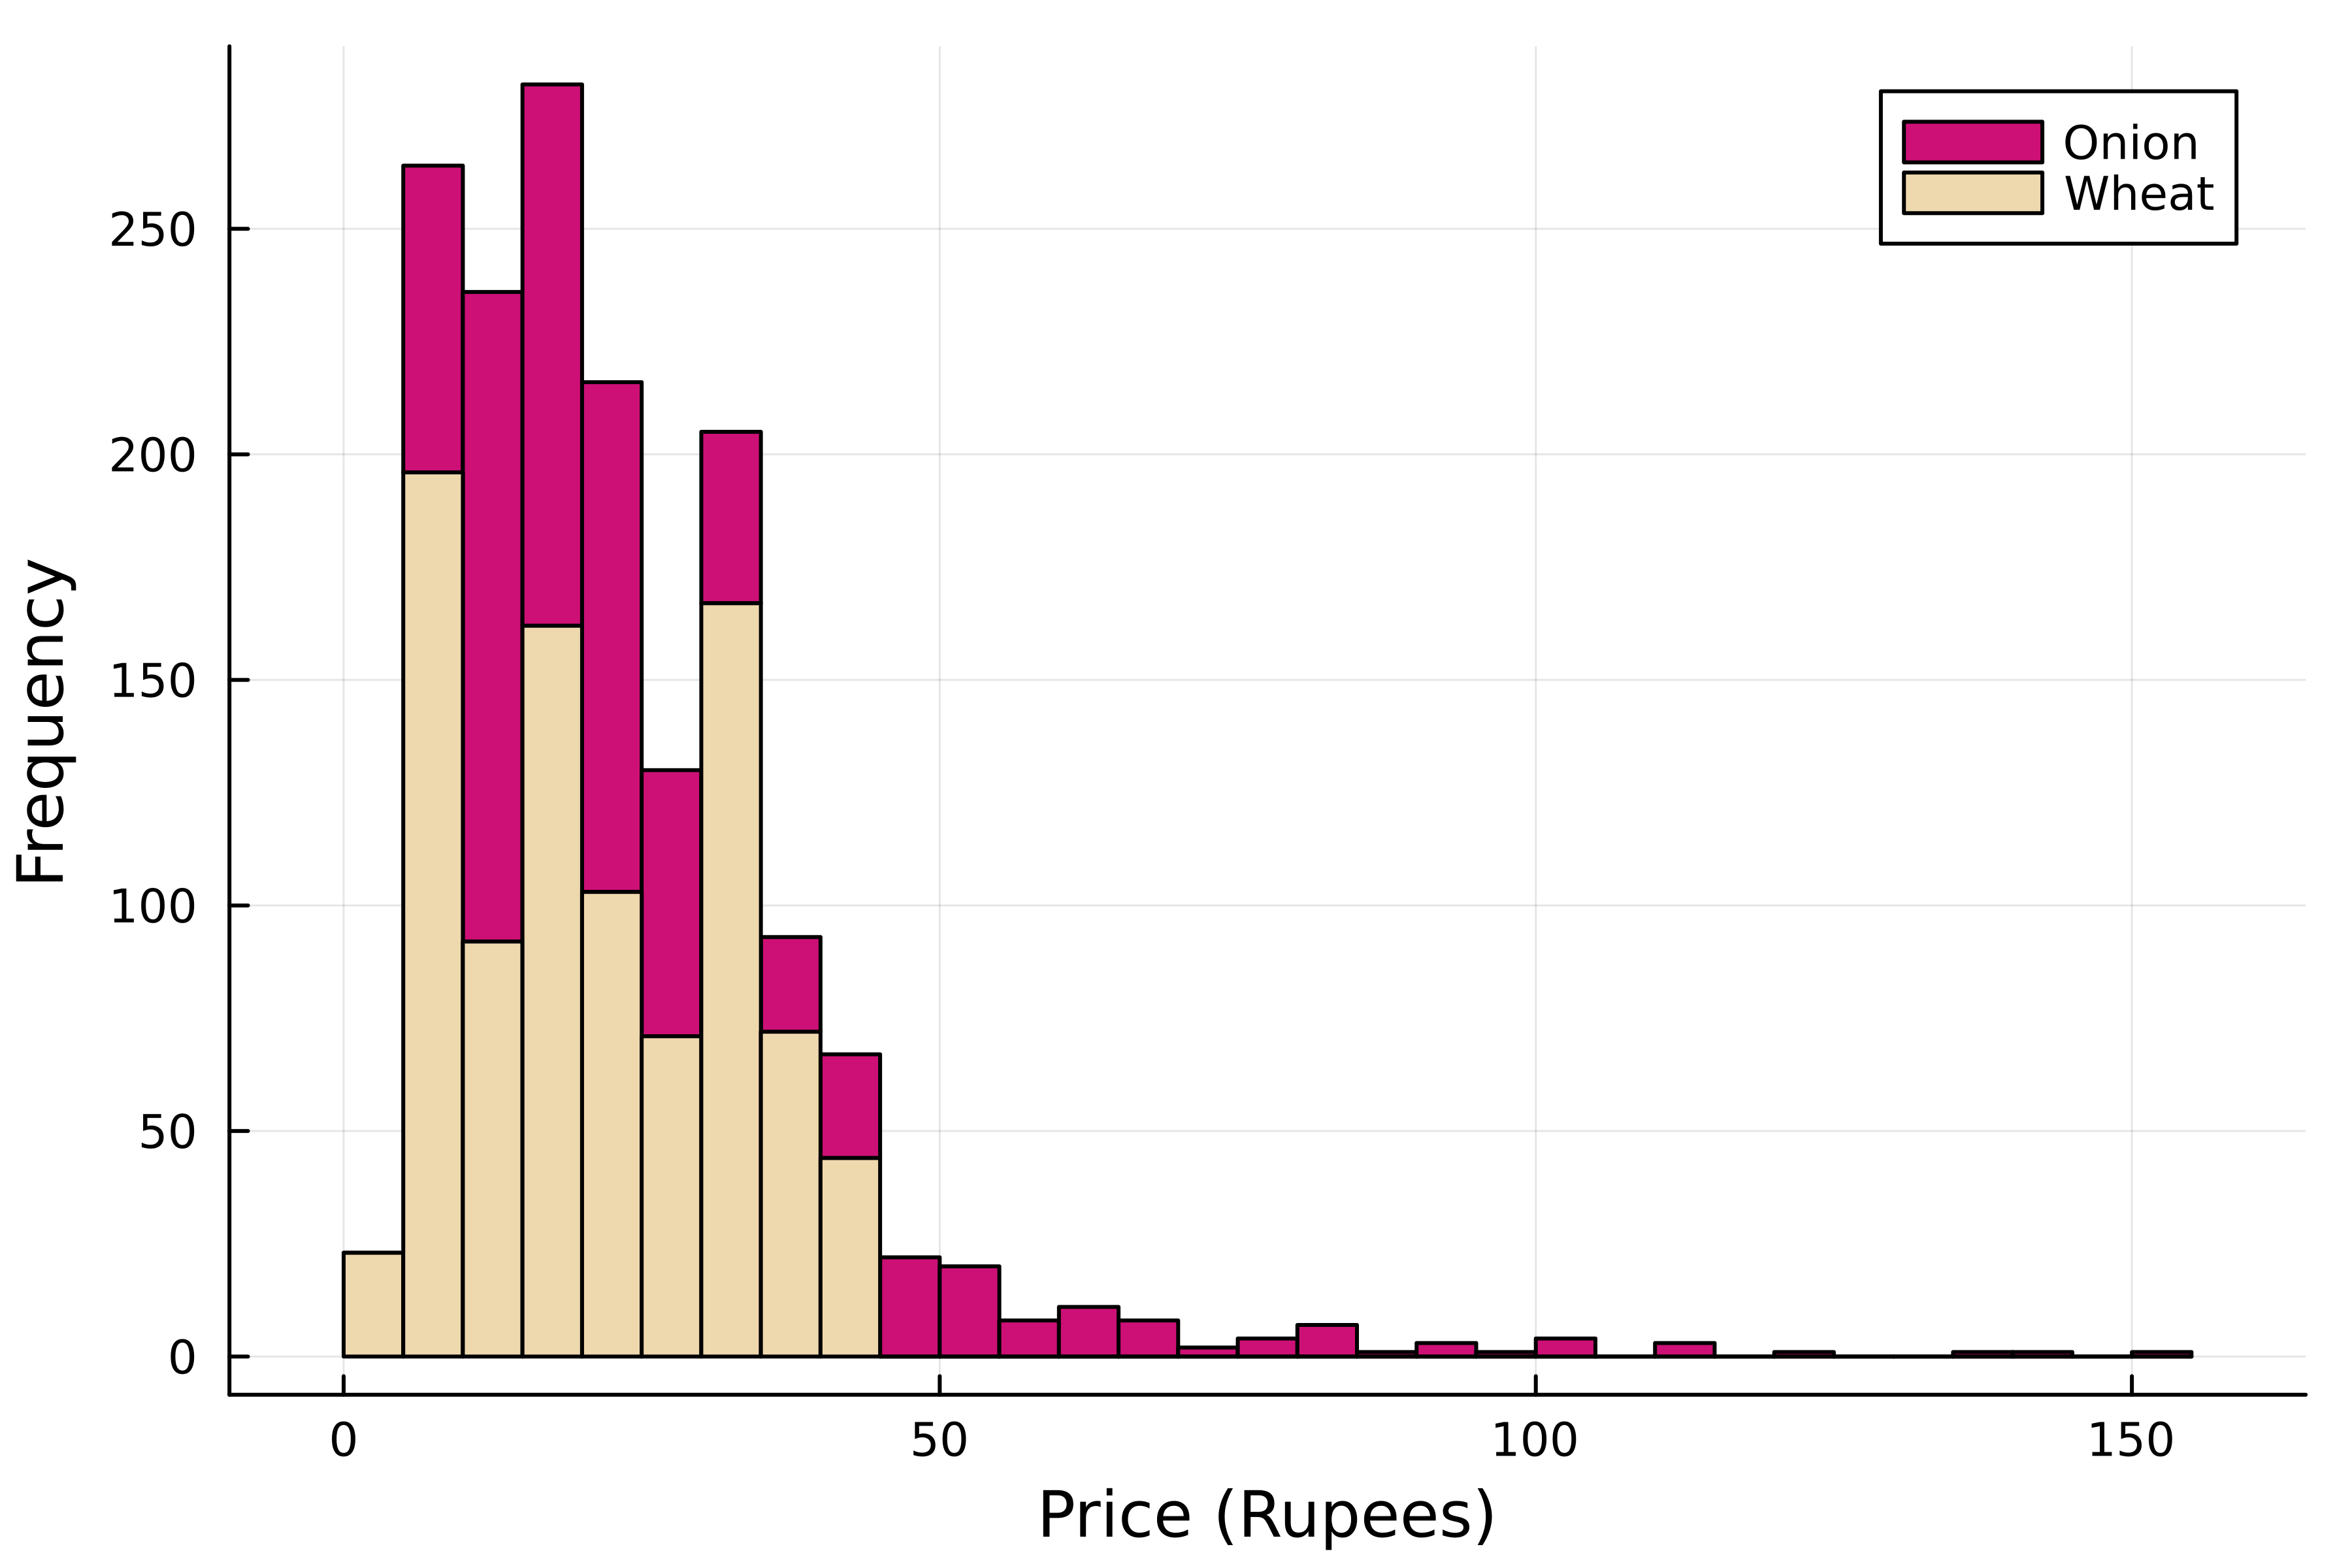
Een subtiel verschil

