De Local Outlier Factor (LOF)

Introductie tot anomaliedetectie in R

Alastair Rushworth

Data Scientist

Nabespreking kNN-afstand

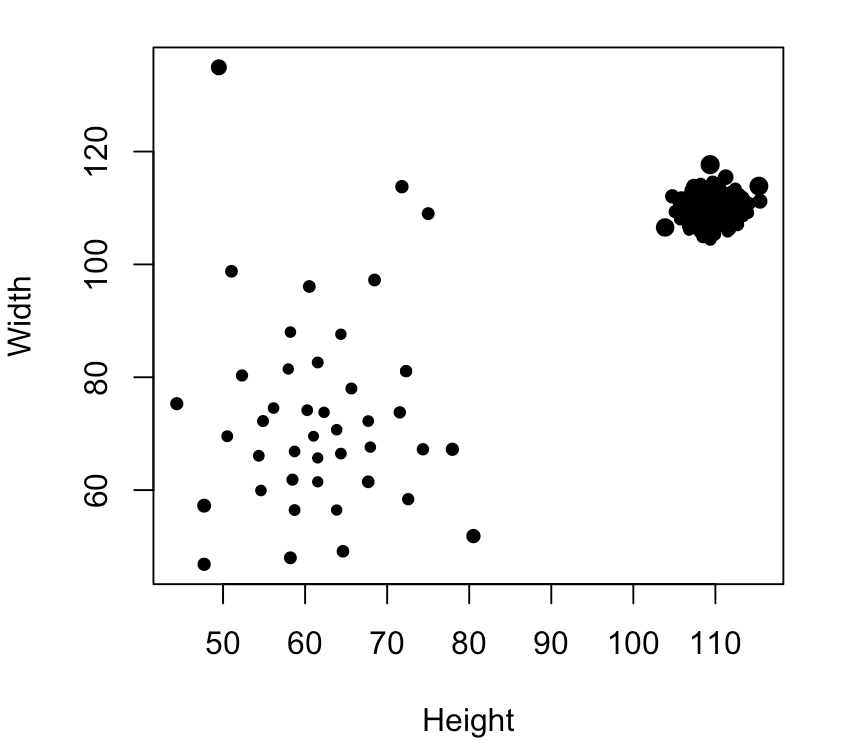
Globale versus lokale anomalieën
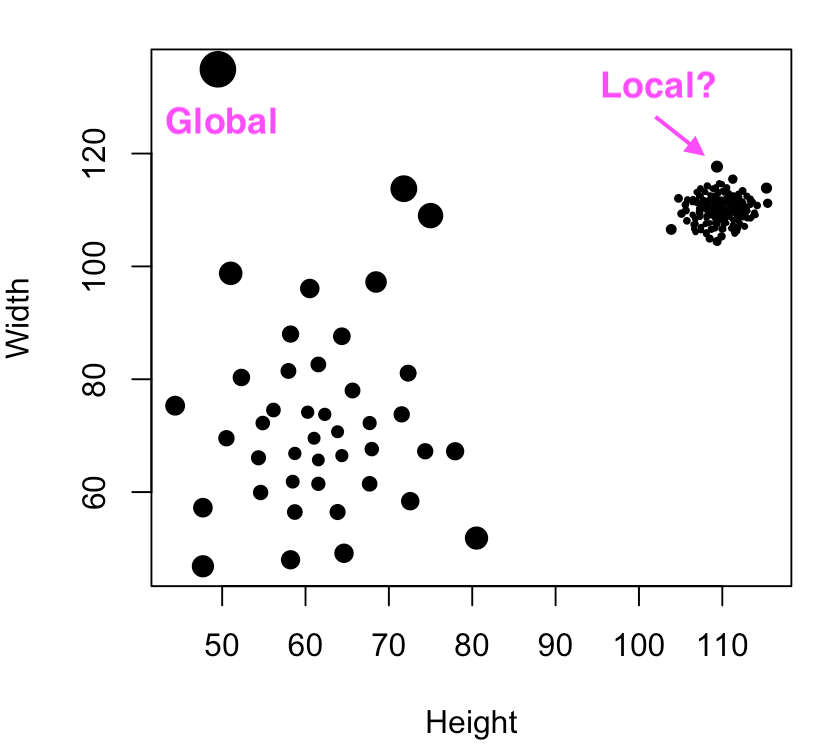
Introductie tot anomaliedetectie in R

LOF berekenen

LOF berekenen voor de meubeldata

library(dbscan)
furniture_lof <- lof(scale(furniture), k = 5)

Bekijk de scores

furniture_lof[1:10]
[1] 1.0649669 1.1071205 0.9980290 1.0392385 0.9725305
[6] 1.1933199 1.3210459 1.1409659 1.0613144 1.0805445
Introductie tot anomaliedetectie in R

LOF interpreteren

LOF is een verhouding van dichtheden

  • LOF $> 1$: meer kans op anomalie
  • LOF $\le 1$: minder kans op anomalie


Hoge LOF-waarden duiden op meer geïsoleerde punten

Introductie tot anomaliedetectie in R

LOF visualiseren

furniture$score_lof <- furniture_lof

plot(Width ~ Height, data = furniture, cex = score_lof, pch = 20)

Introductie tot anomaliedetectie in R

Laten we oefenen!

Introductie tot anomaliedetectie in R

Preparing Video For Download...