Gelabelde anomalieën

Introductie tot anomaliedetectie in R

Alastair Rushworth

Data Scientist

Satellietbeeld-data

head(sat, 5)
  label V1  V2  V3 V4 V5
1     0 92 115 120 94 84
2     0 84 102 106 79 84
3     0 84 102 102 83 80
4     0 80 102 102 79 84
5     0 84  94 102 79 80
Introductie tot anomaliedetectie in R

Satellietbeeld-data

table(sat$label)
   0    1 
5732   71

Aandeel katoenpercelen:

71 / 5803
0.01223505
Introductie tot anomaliedetectie in R

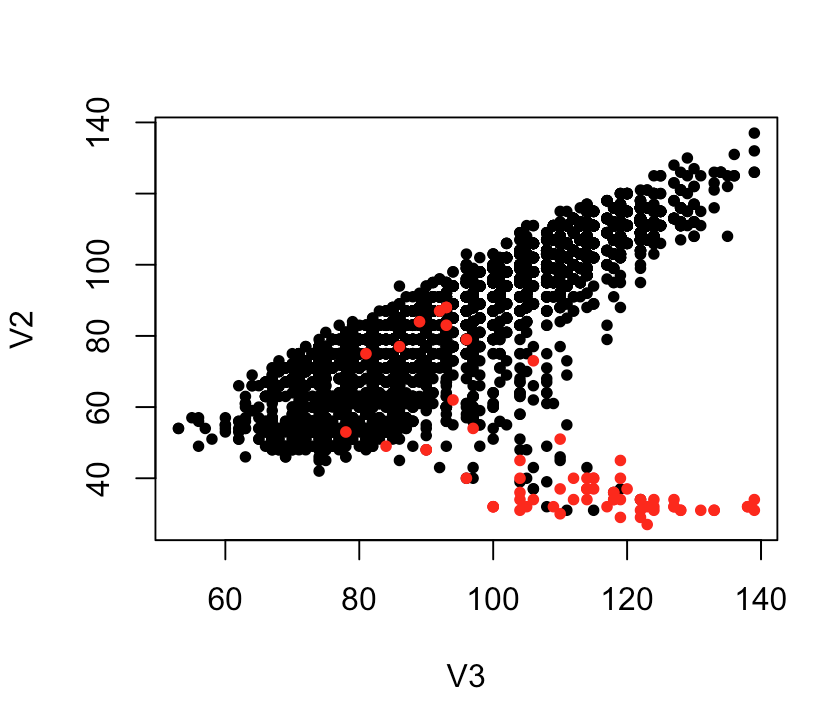
Echte anomalieën visualiseren

plot(V2 ~ V3, data = sat, col = as.factor(label), pch = 20)

Introductie tot anomaliedetectie in R

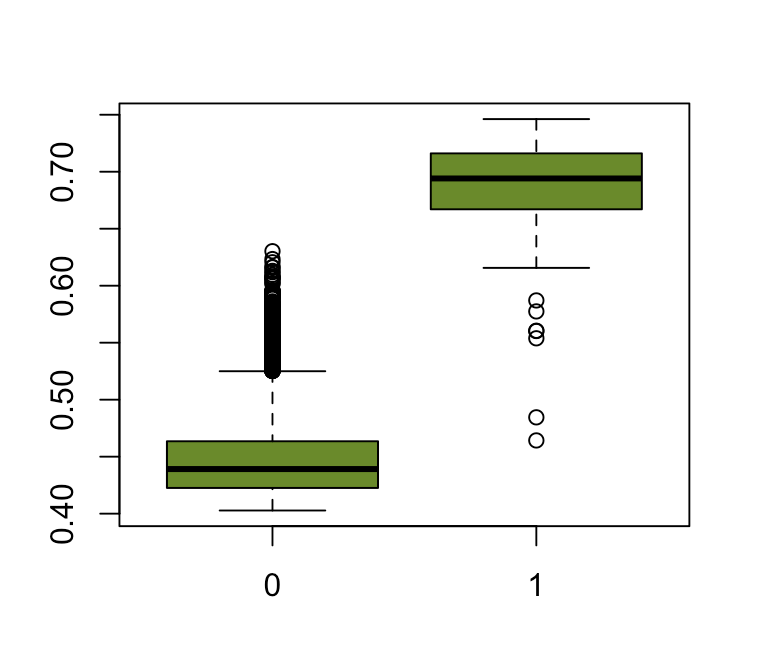
Anomaliescore vs. echte label

sat_for <- iForest(sat[, -1], nt = 100)
sat$score <- predict(sat_for, features)

boxplot(score ~ label, data = sat, col = "olivedrab4")

Introductie tot anomaliedetectie in R

Waarom geen modellen om labels te voorspellen?

Voorbeeld 1: Zeldzame ziektegevallen detecteren

  • Te weinig gevallen


Voorbeeld 2: Creditcardfraude

  • Verandert snel
Introductie tot anomaliedetectie in R

Laten we oefenen!

Introductie tot anomaliedetectie in R

Preparing Video For Download...