Meerdere afwijkingen detecteren in seizoensreeksen

Introductie tot anomaliedetectie in R

Alastair Rushworth

Data Scientist

Maandelijkse omzetgegevens

head(msales)
  sales month
1 6.068     1
2 5.966     2
3 6.133     3
4 6.230     4
5 6.407     5
6 6.433     6

Grubbs-test hier niet geschikt

  • Mogelijke seizoensinvloed
  • Mogelijk meerdere afwijkingen
Introductie tot anomaliedetectie in R

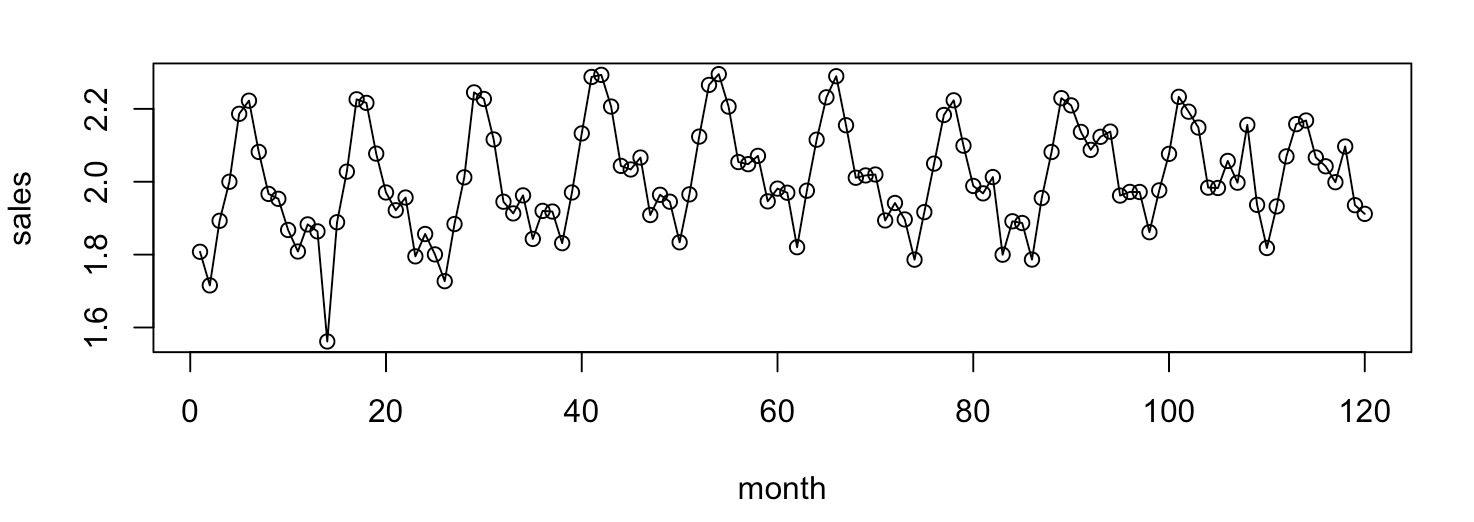
Maandelijkse omzet visualiseren

plot(sales ~ month, data = msales, type = 'o')

Introductie tot anomaliedetectie in R

Seasonal-Hybrid ESD-algoritme gebruiken

library(AnomalyDetection)
sales_ad <- AnomalyDetectionVec(x = msales$sales, period = 12, 
                                direction = 'both')

Argumenten

  • x: vector met waarden
  • period: periode van het herhalende patroon
  • direction: vind kleine ('neg'), grote ('pos') of beide ('both') afwijkingen

Pakket downloaden via https://github.com/twitter/AnomalyDetection

Introductie tot anomaliedetectie in R

Uitvoer van het Seasonal-Hybrid ESD-algoritme

sales_ad <- AnomalyDetectionVec(x = msales$sales, period = 12, 
                                direction = 'both')
sales_ad$anoms
  index anoms
1    14 1.561
2   108 2.156
Introductie tot anomaliedetectie in R

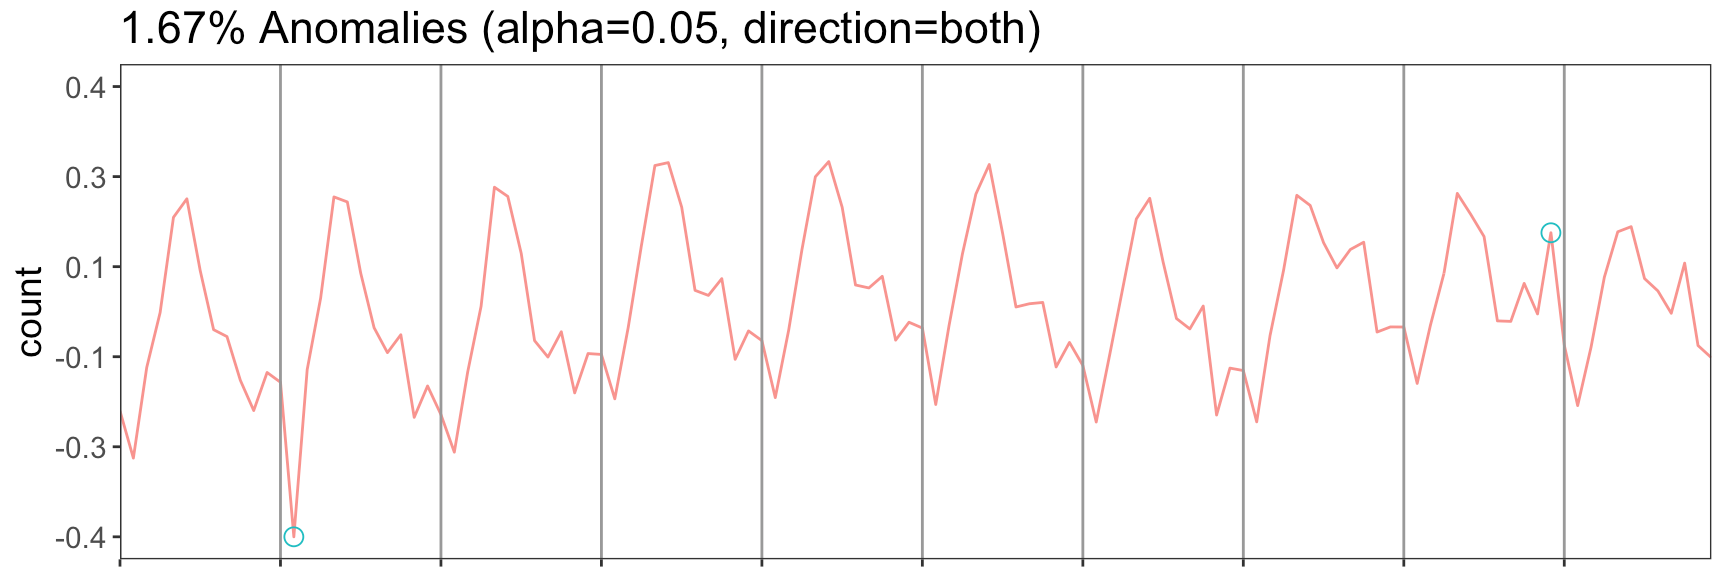
Plot van het Seasonal-Hybrid ESD-algoritme

AnomalyDetectionVec(x = msales$sales, period = 12, 
                    direction = 'both', plot = T)

Introductie tot anomaliedetectie in R

Laten we oefenen!

Introductie tot anomaliedetectie in R

Preparing Video For Download...