Modeldrift
Forecasting-pijplijnen ontwerpen voor productie

Rami Krispin
Senior Manager, Data Science and Engineering
Modeldrift
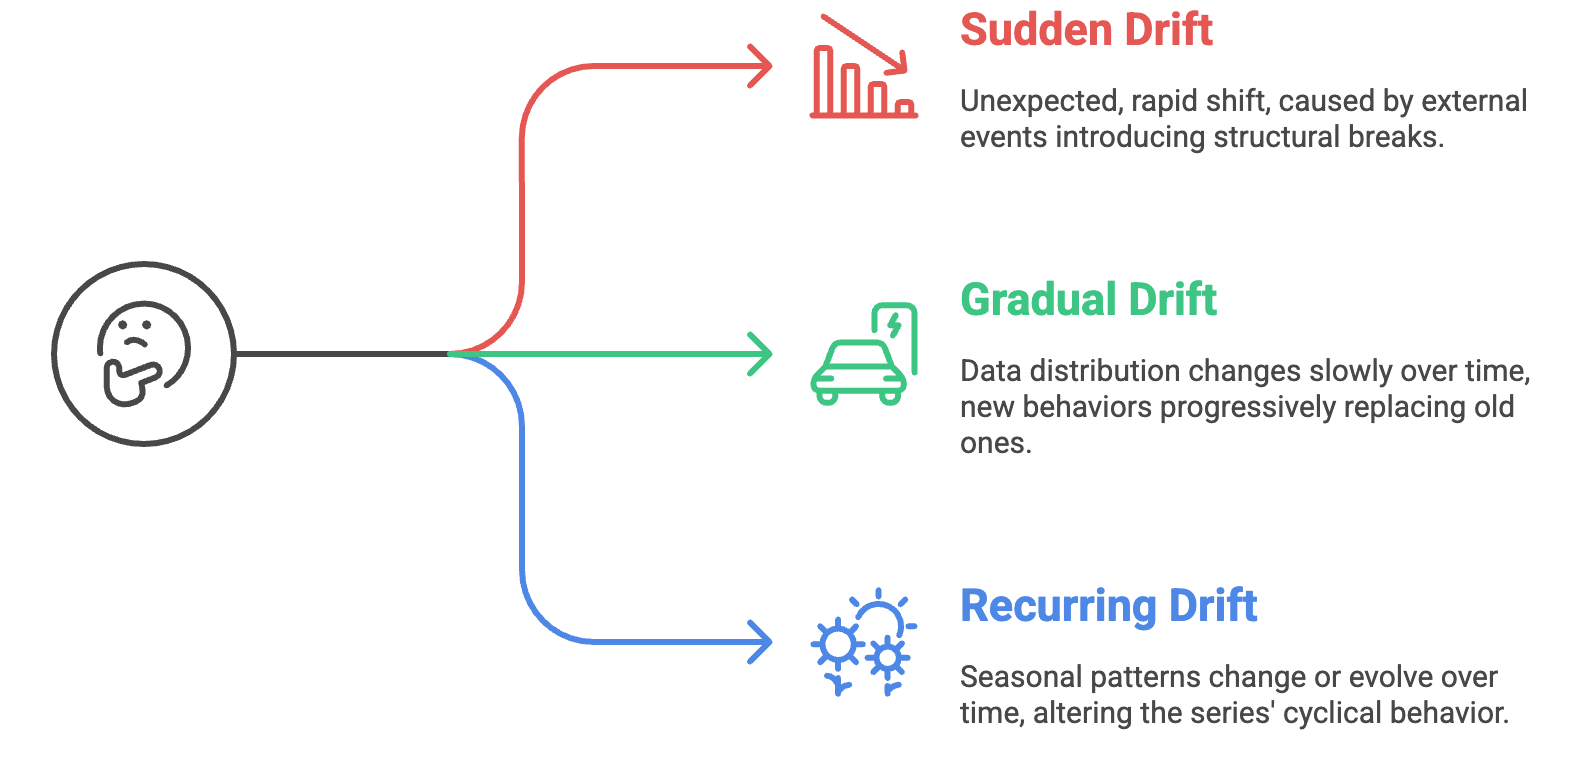
Conceptdrift
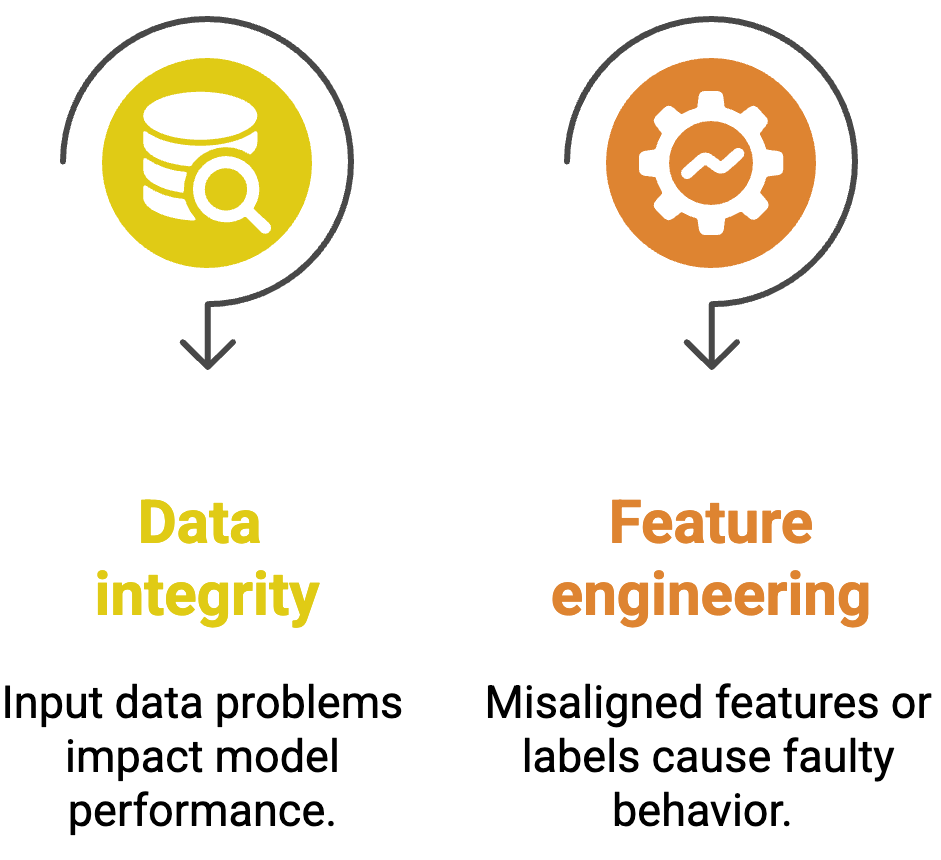
Andere oorzaken van modeldrift
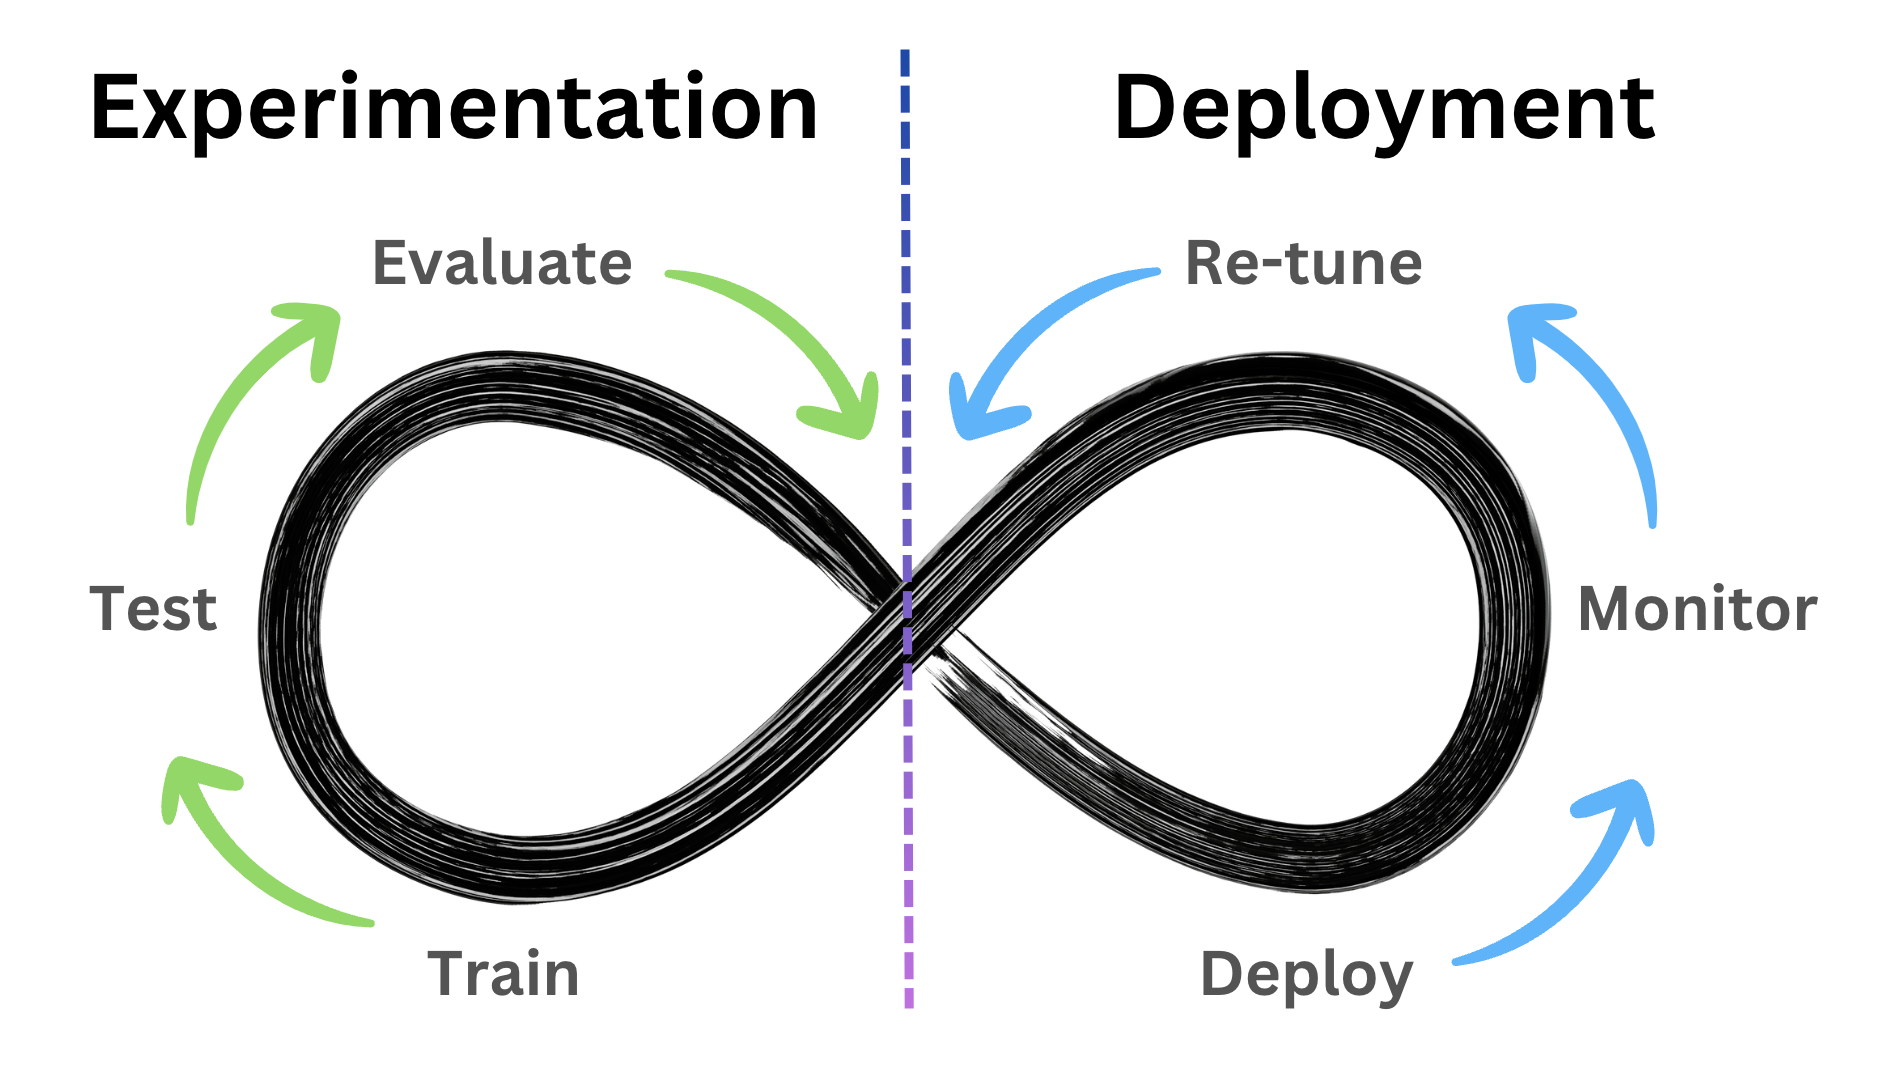
Modellevenscyclus
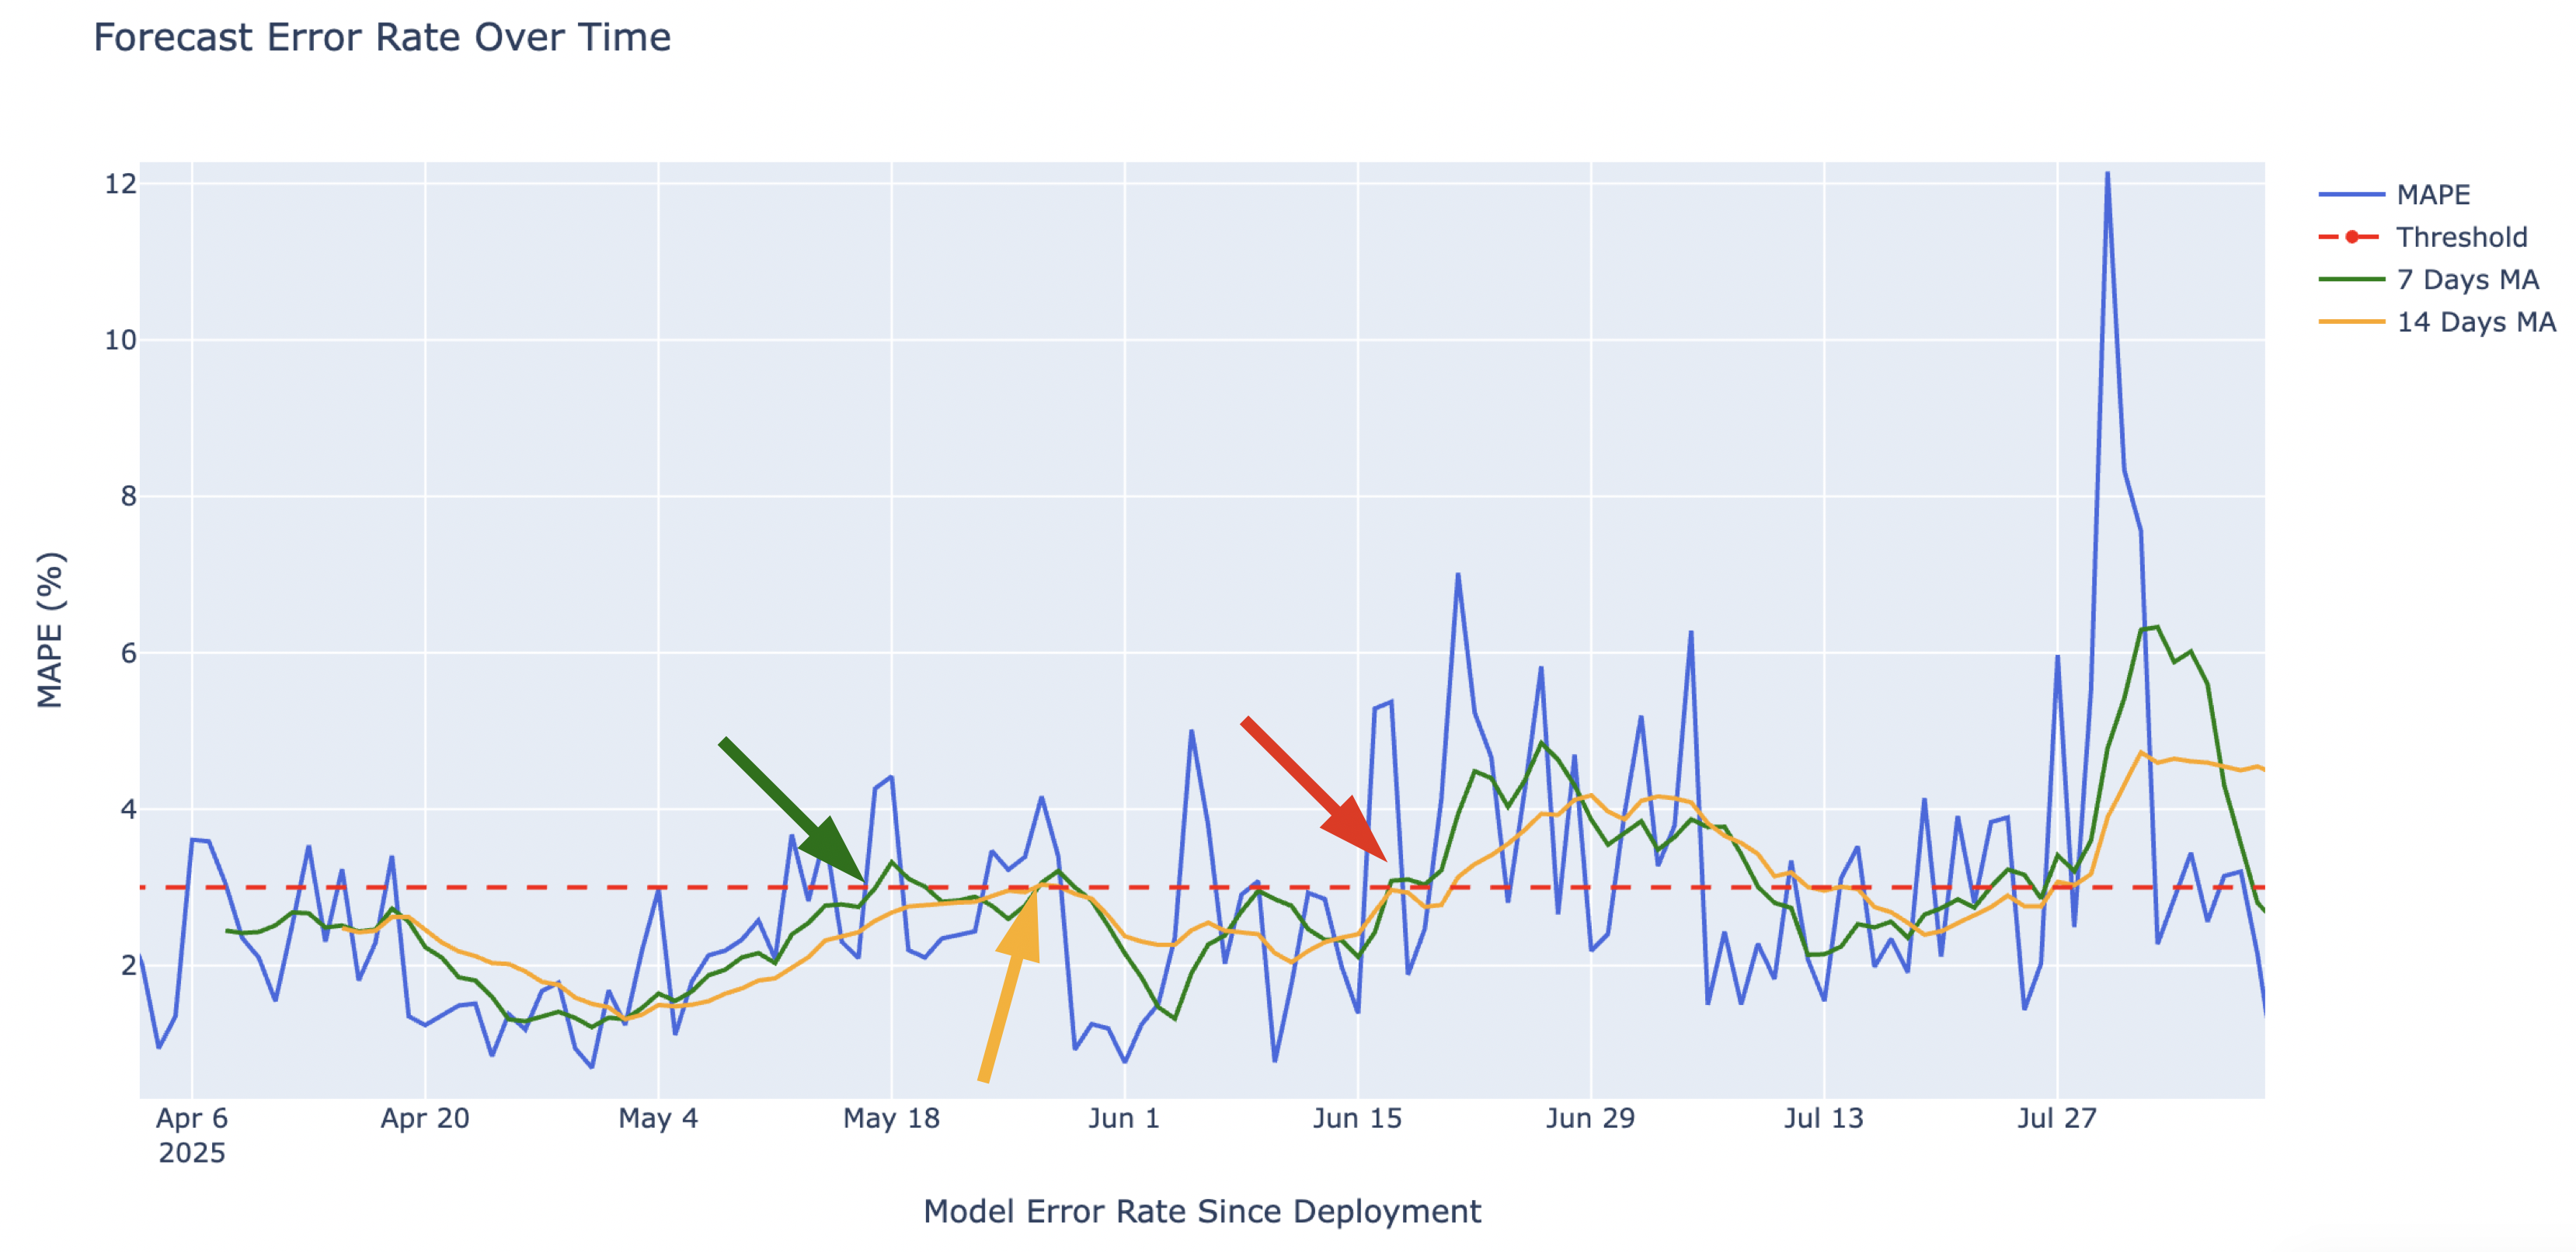
Detecteer modeldrift
$$
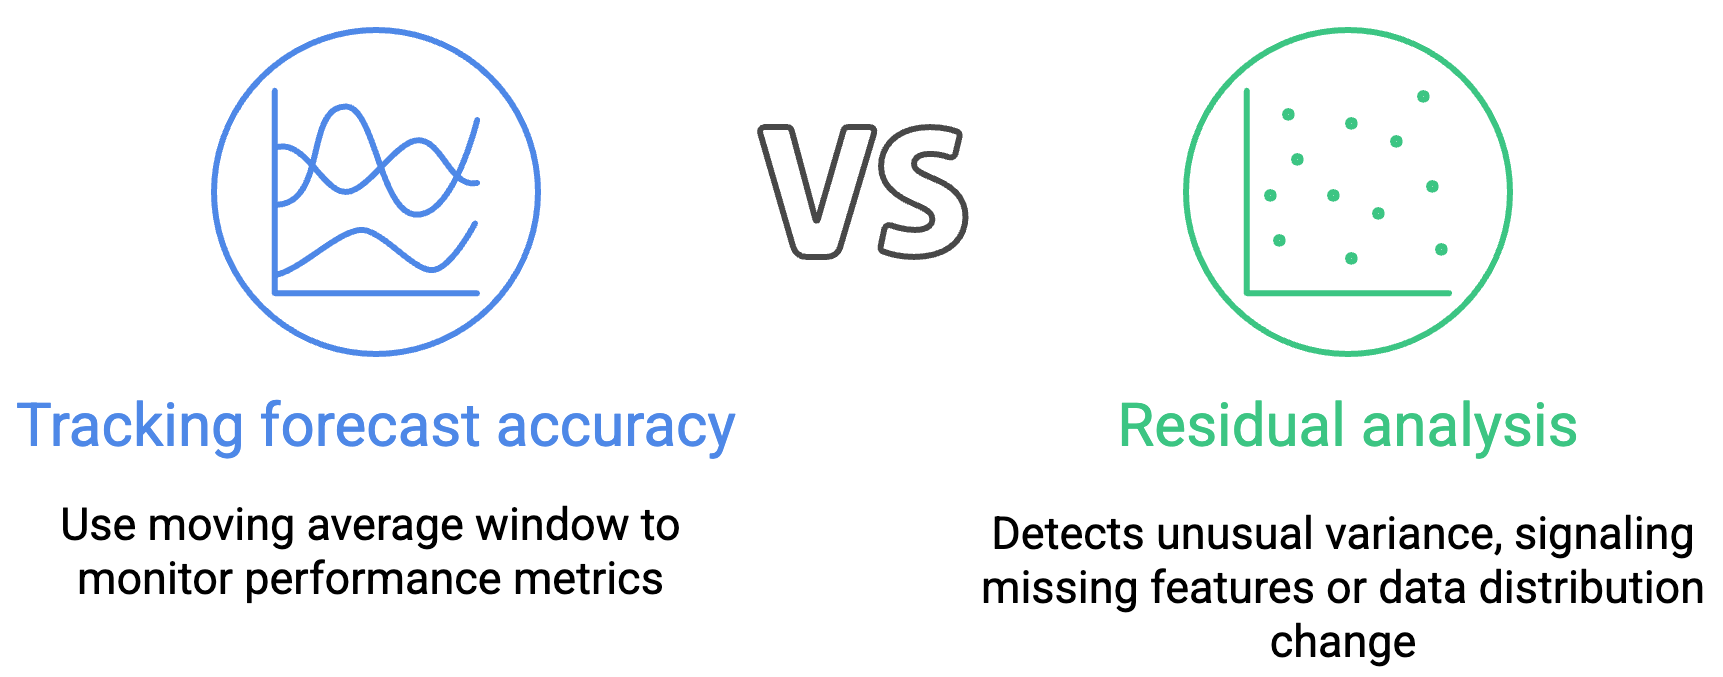
Detecteer modeldrift
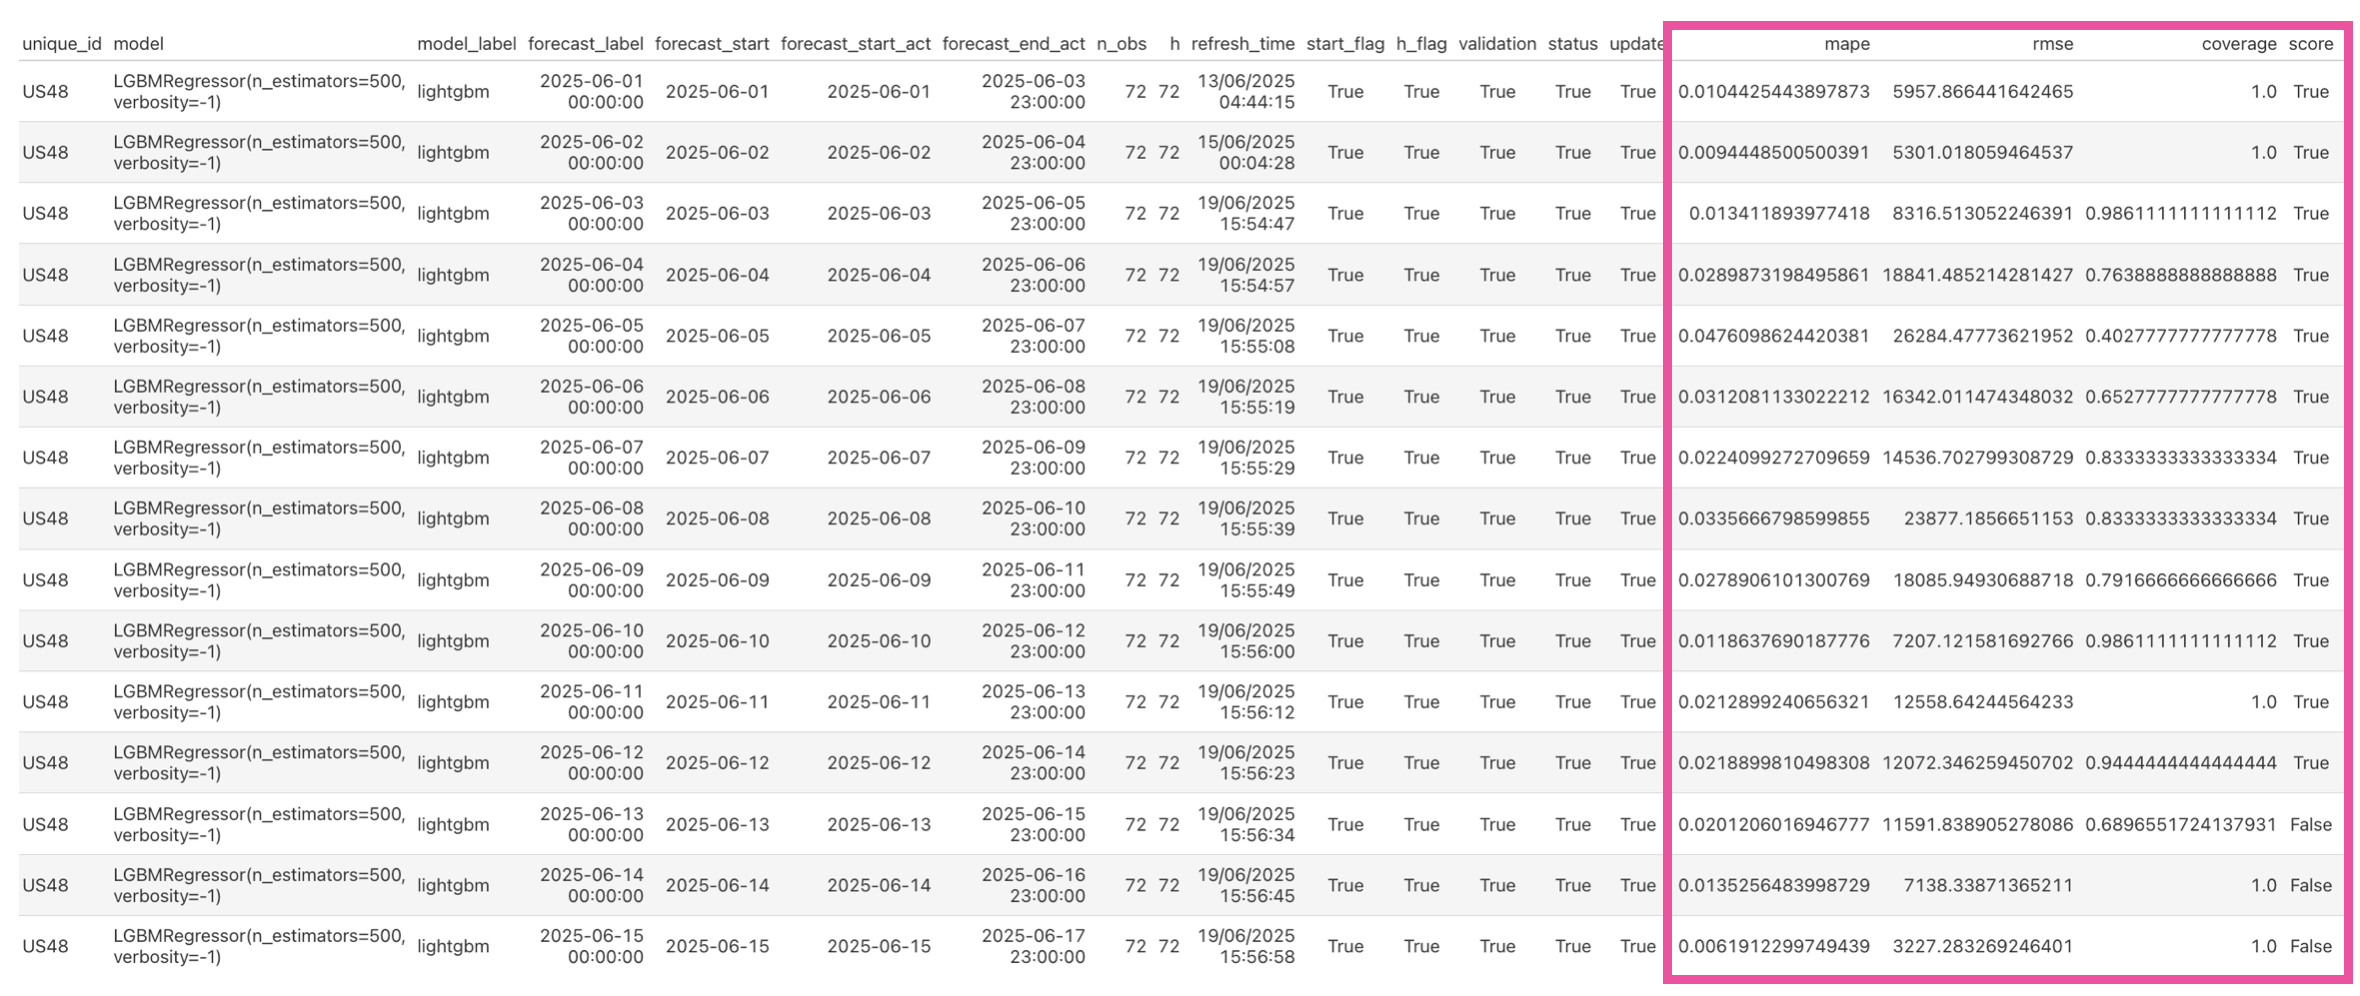
Drift vaststellen
Drift vaststellen
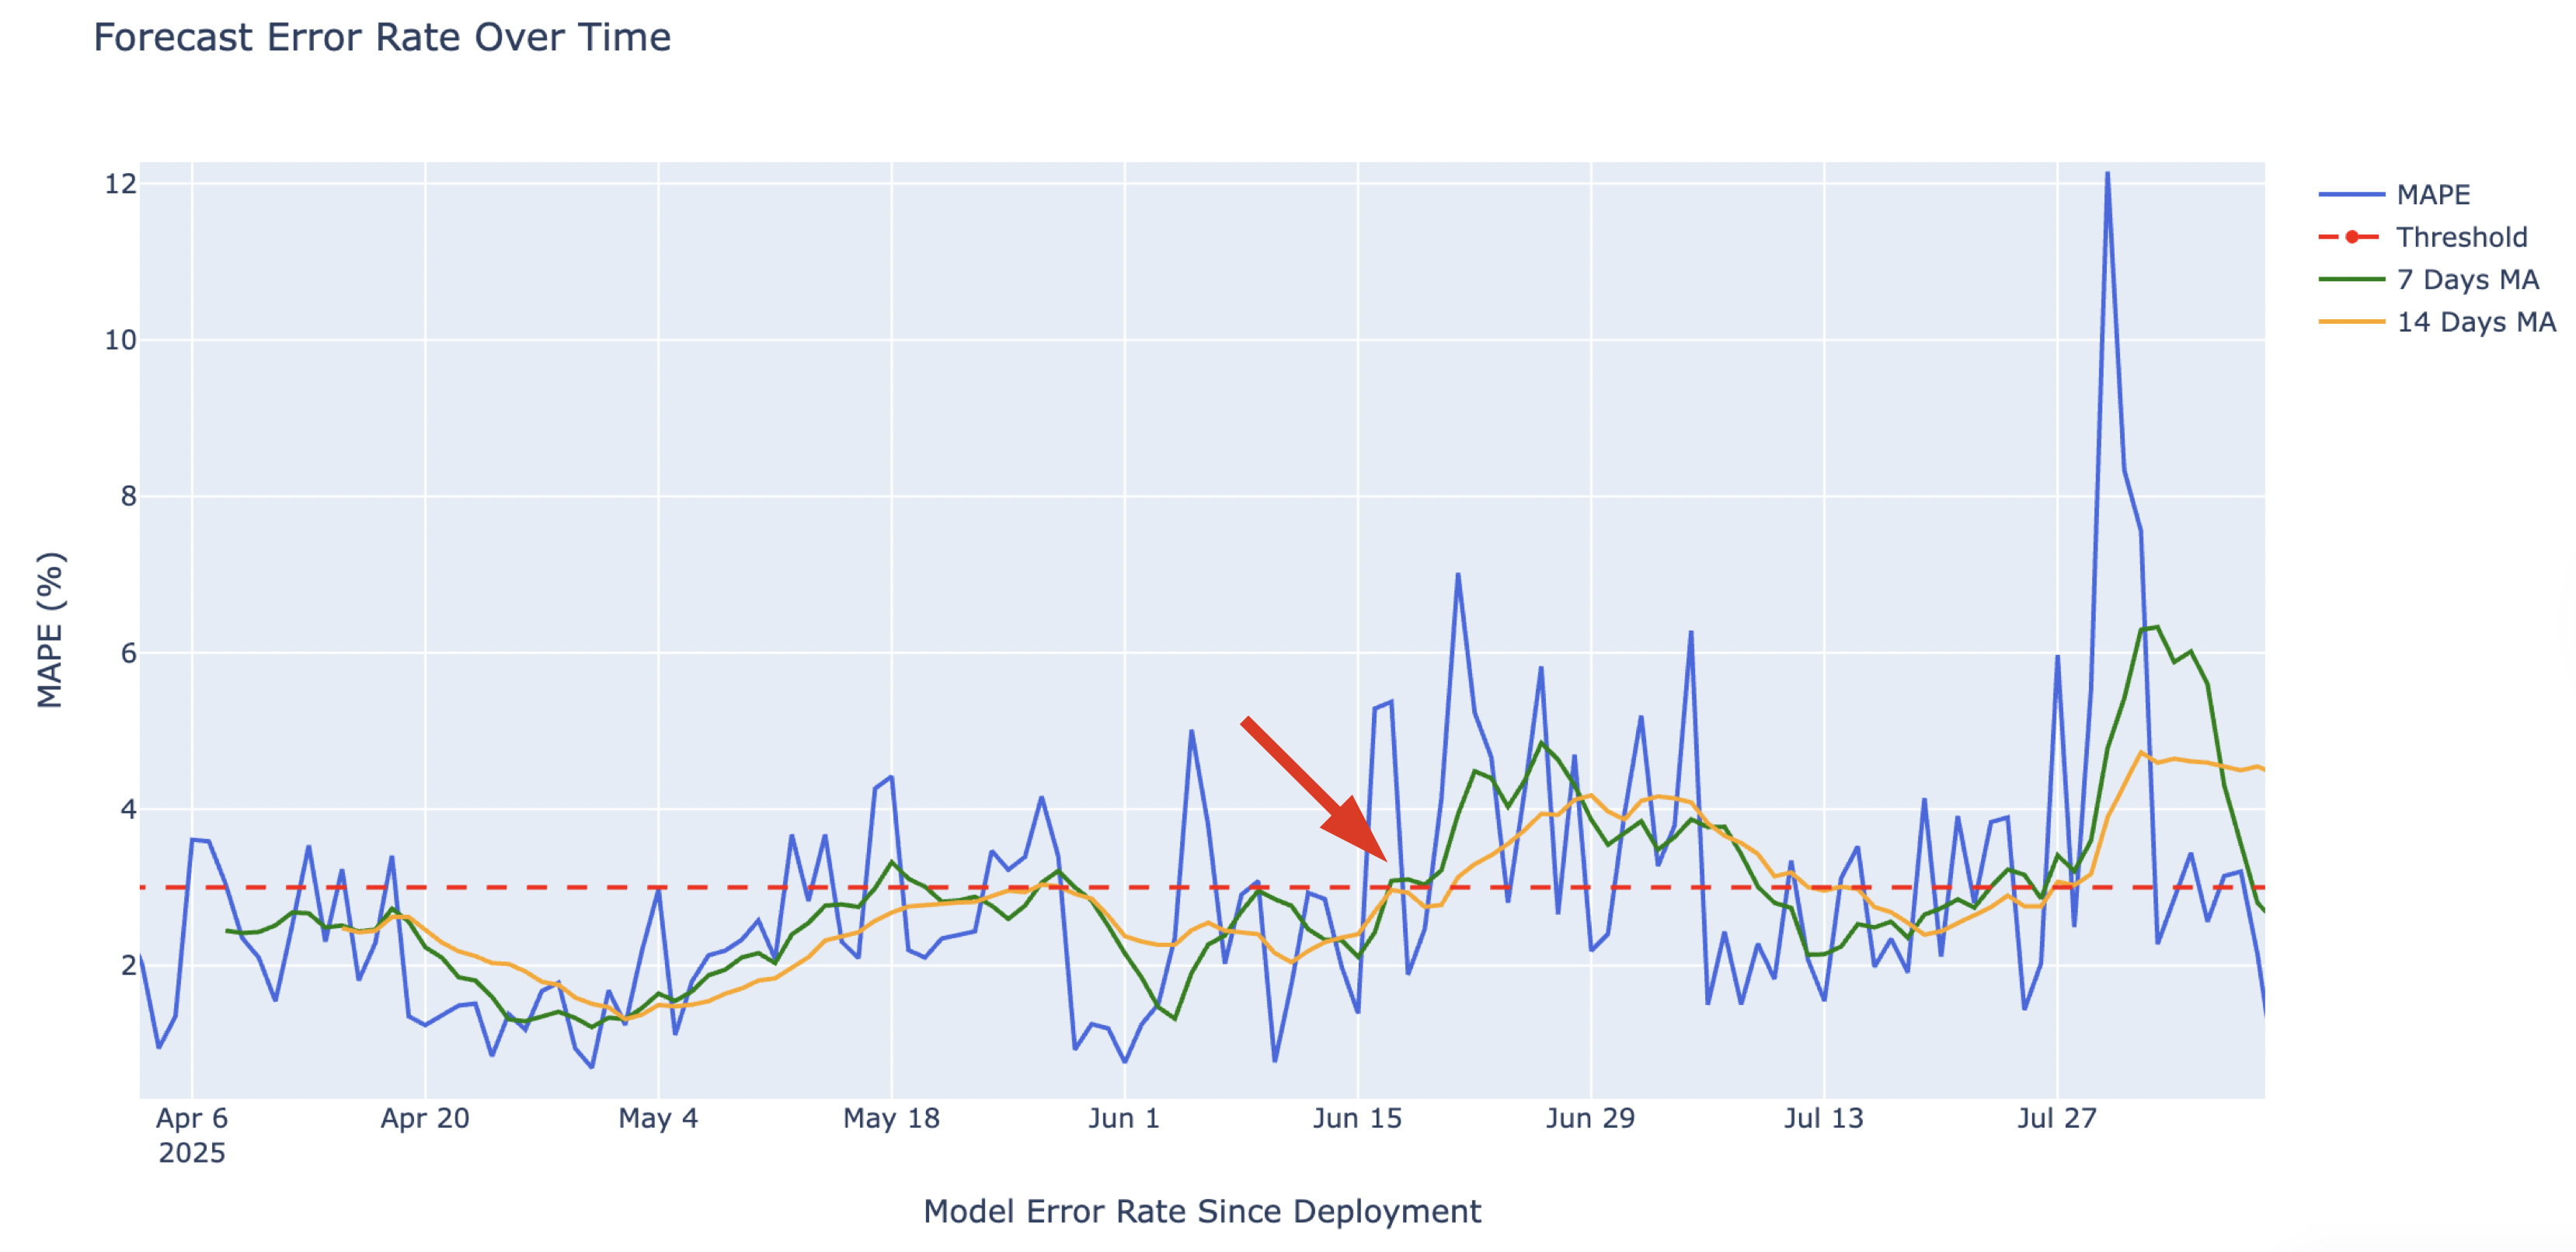
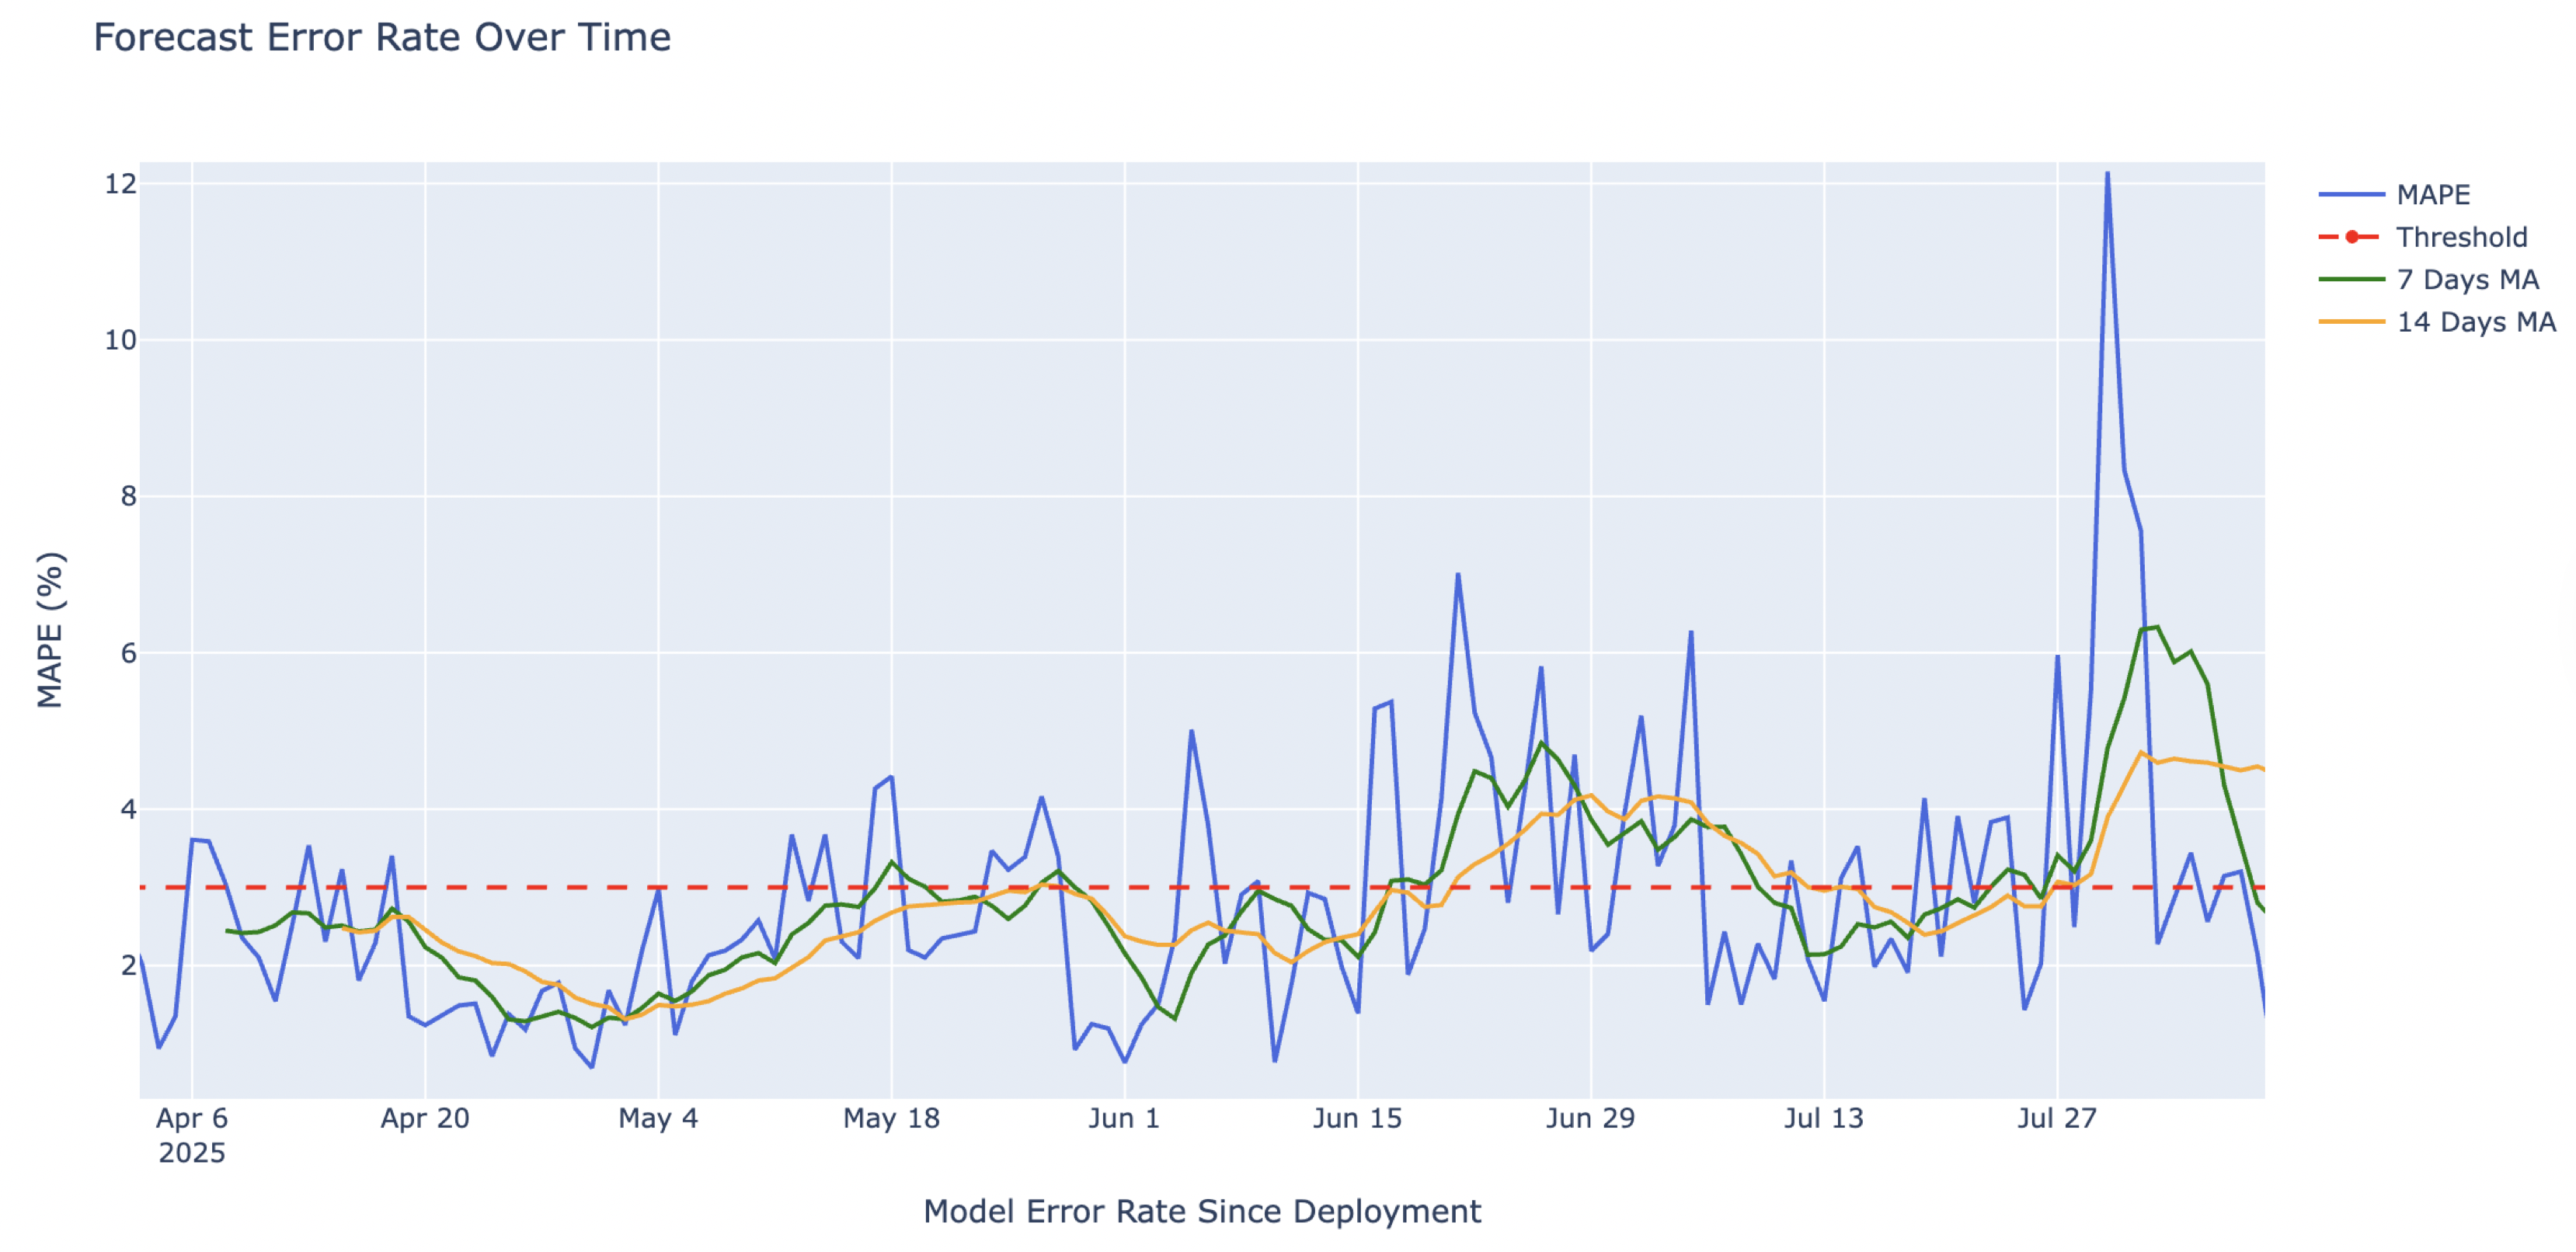
Drift vaststellen
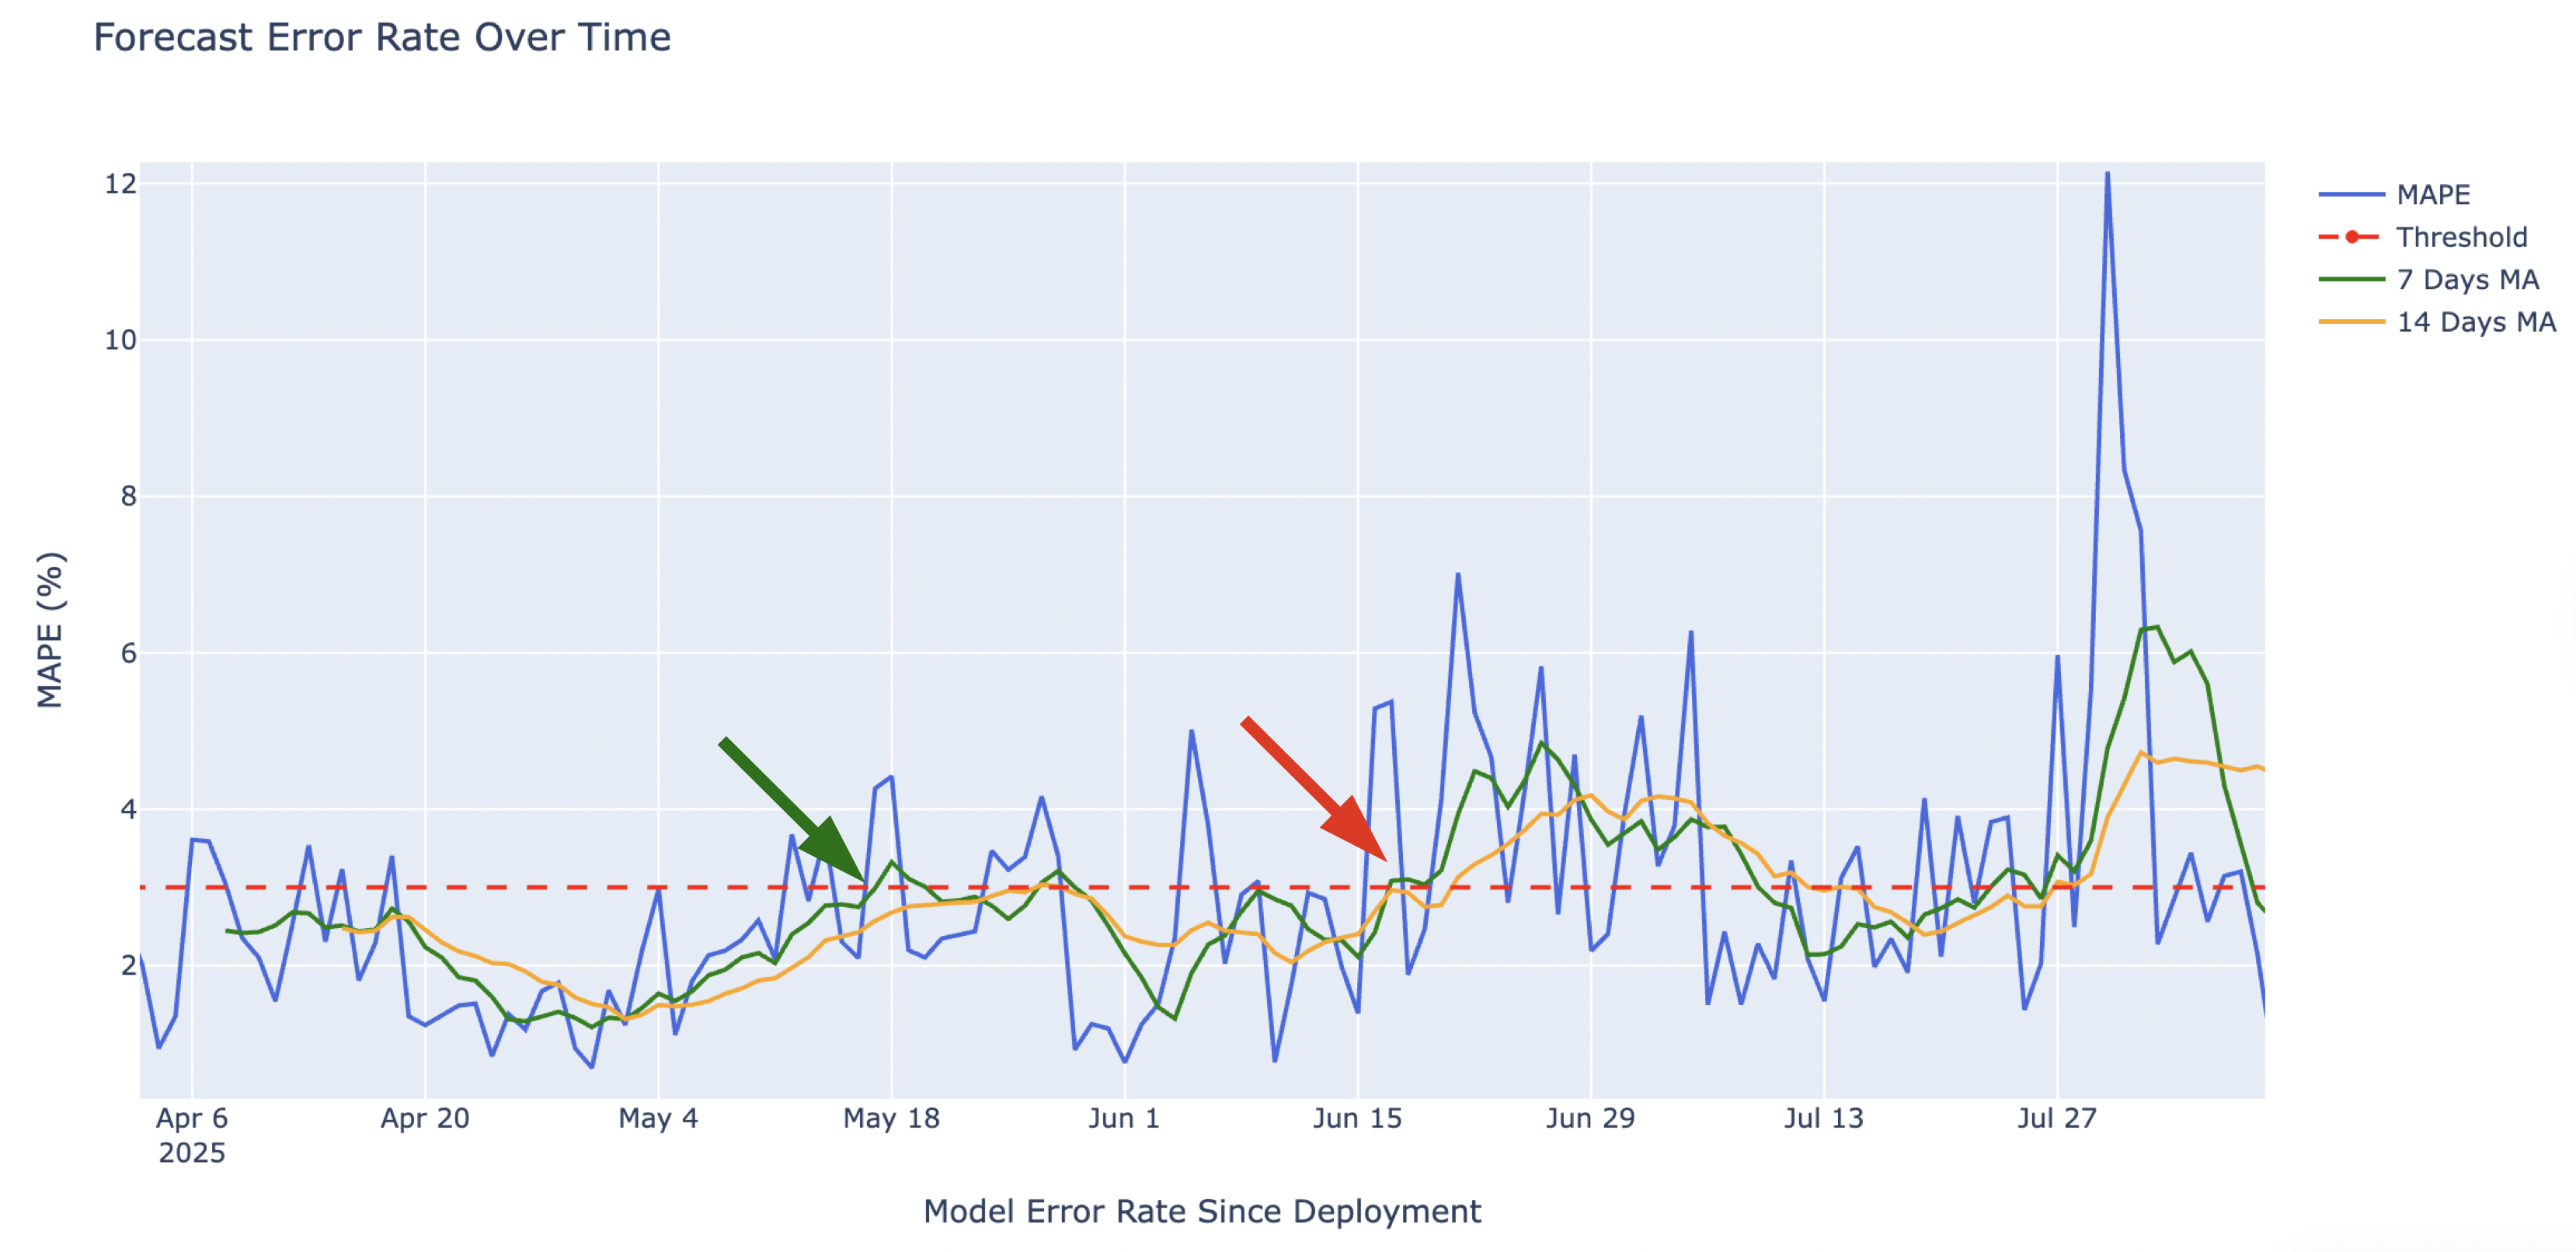
Drift vaststellen