Plot garis
Pengantar Visualisasi Data dengan ggplot2

Rick Scavetta
Founder, Scavetta Academy
Berang-berang
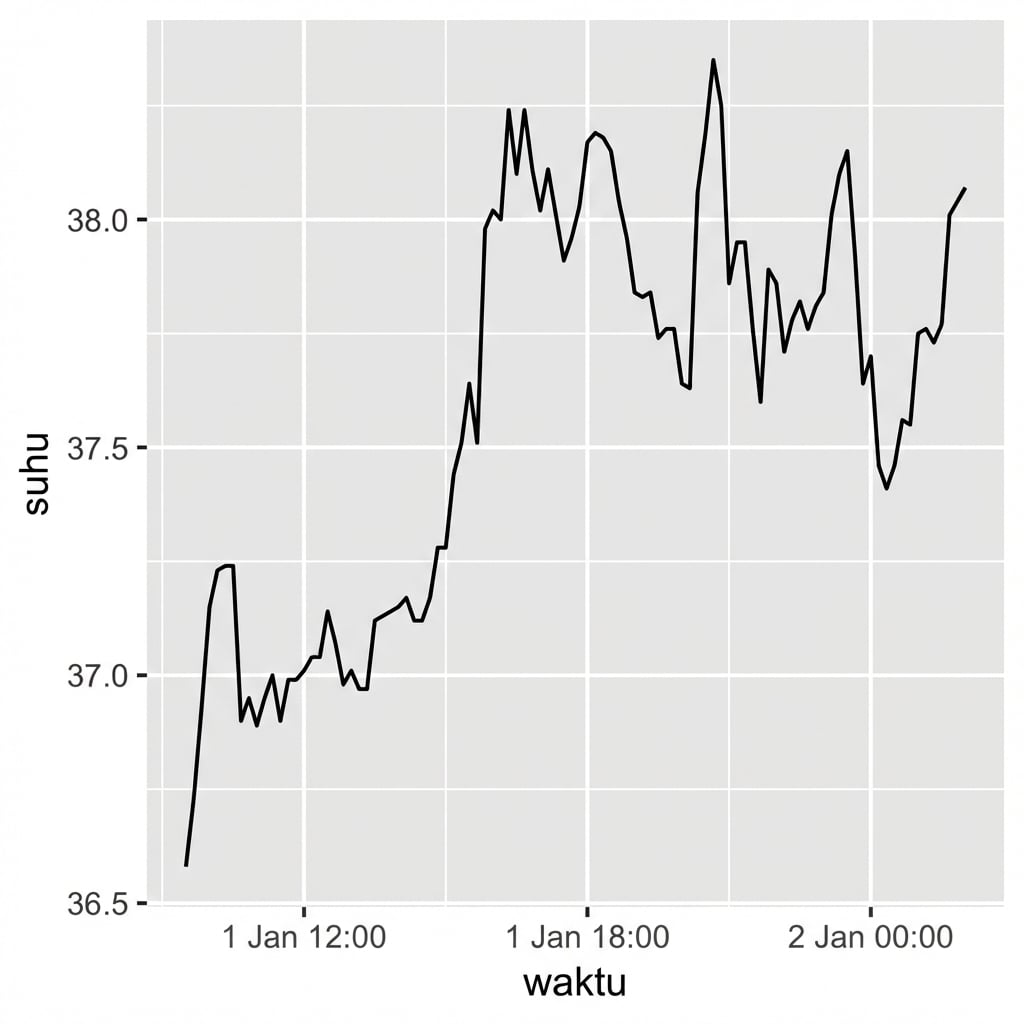
Berang-berang
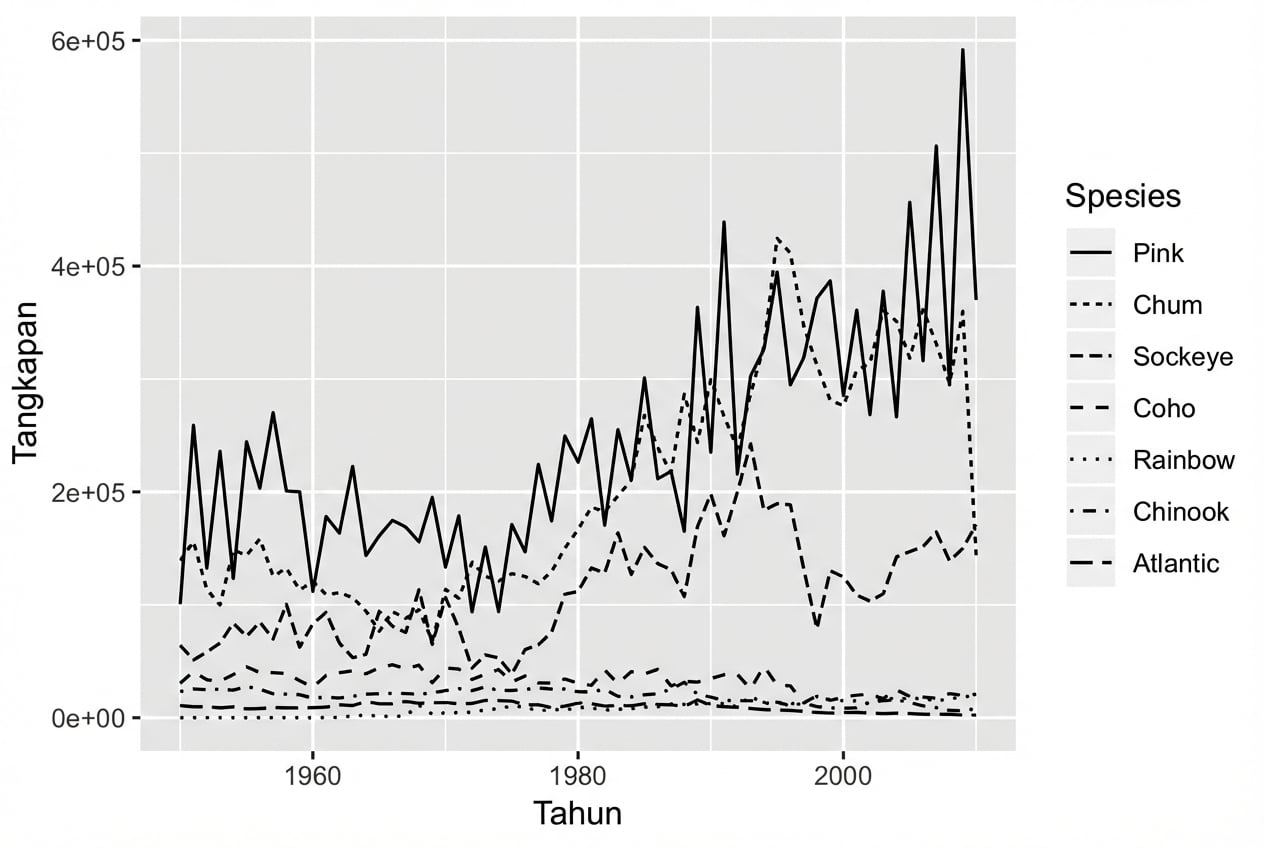
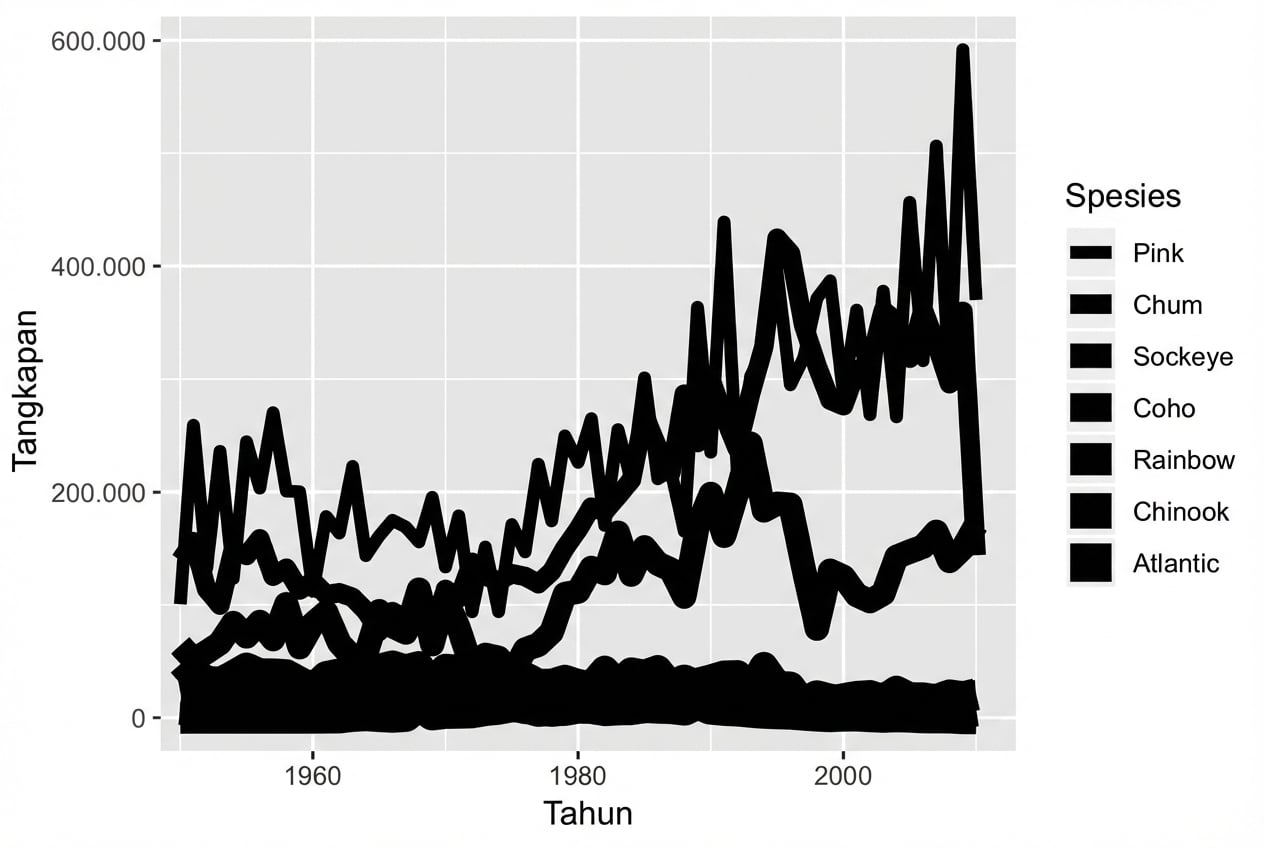
Aestetik linetype
Aestetik size
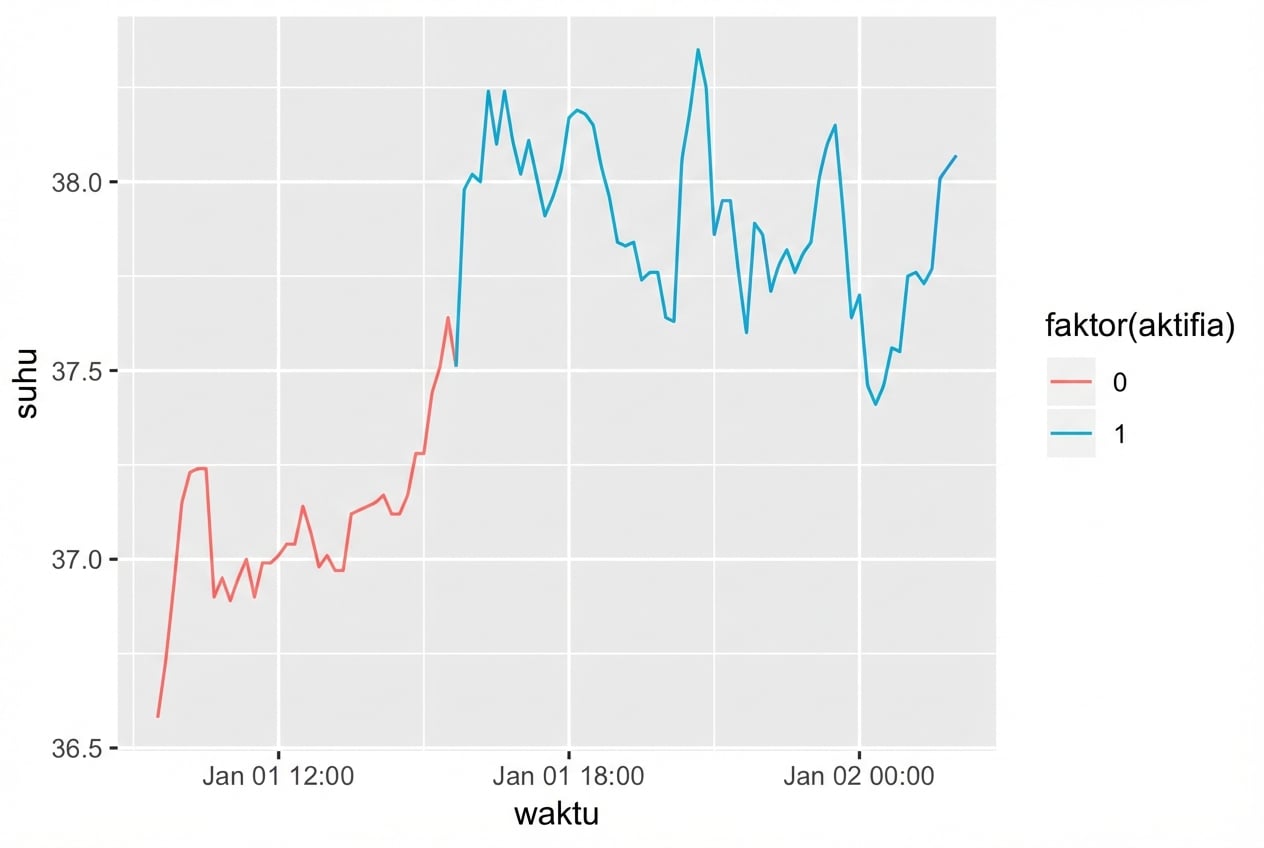
Aestetik color
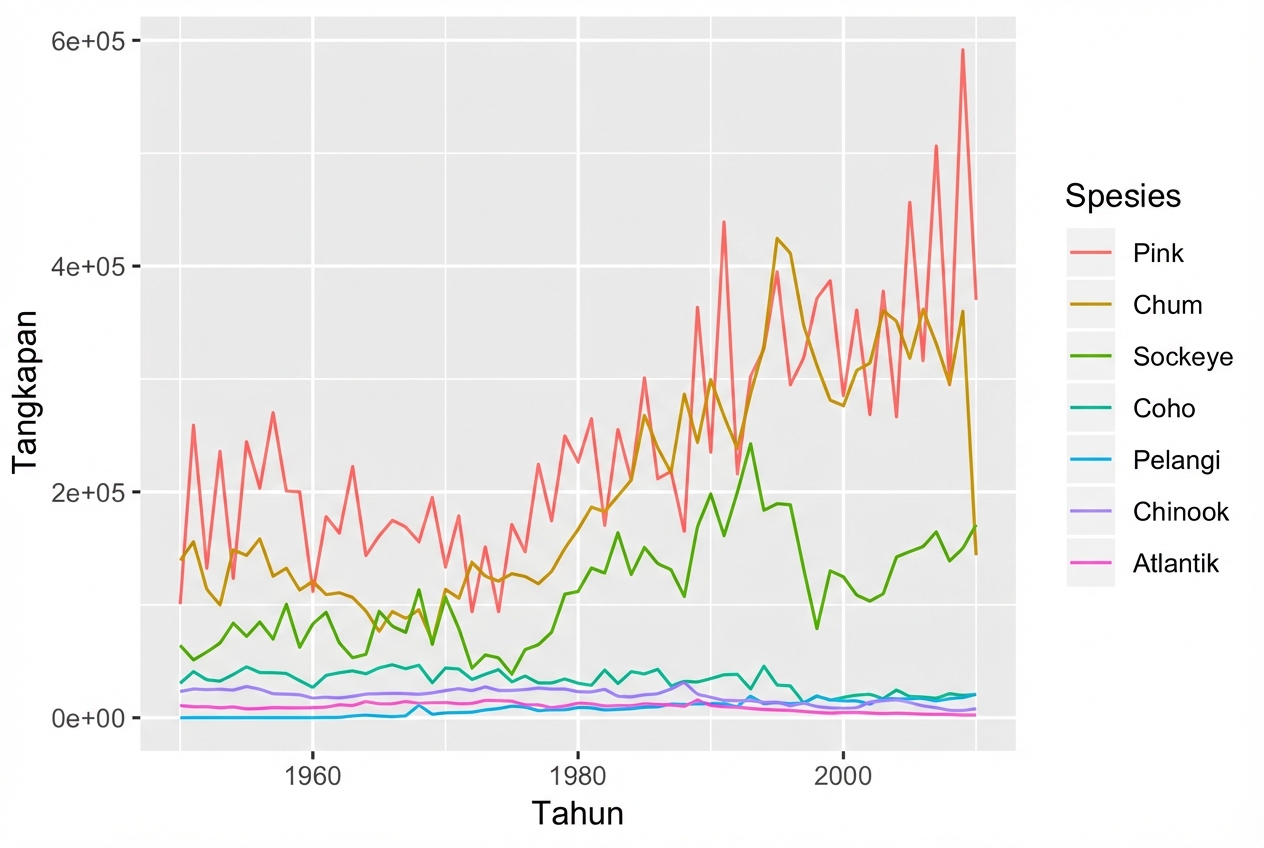
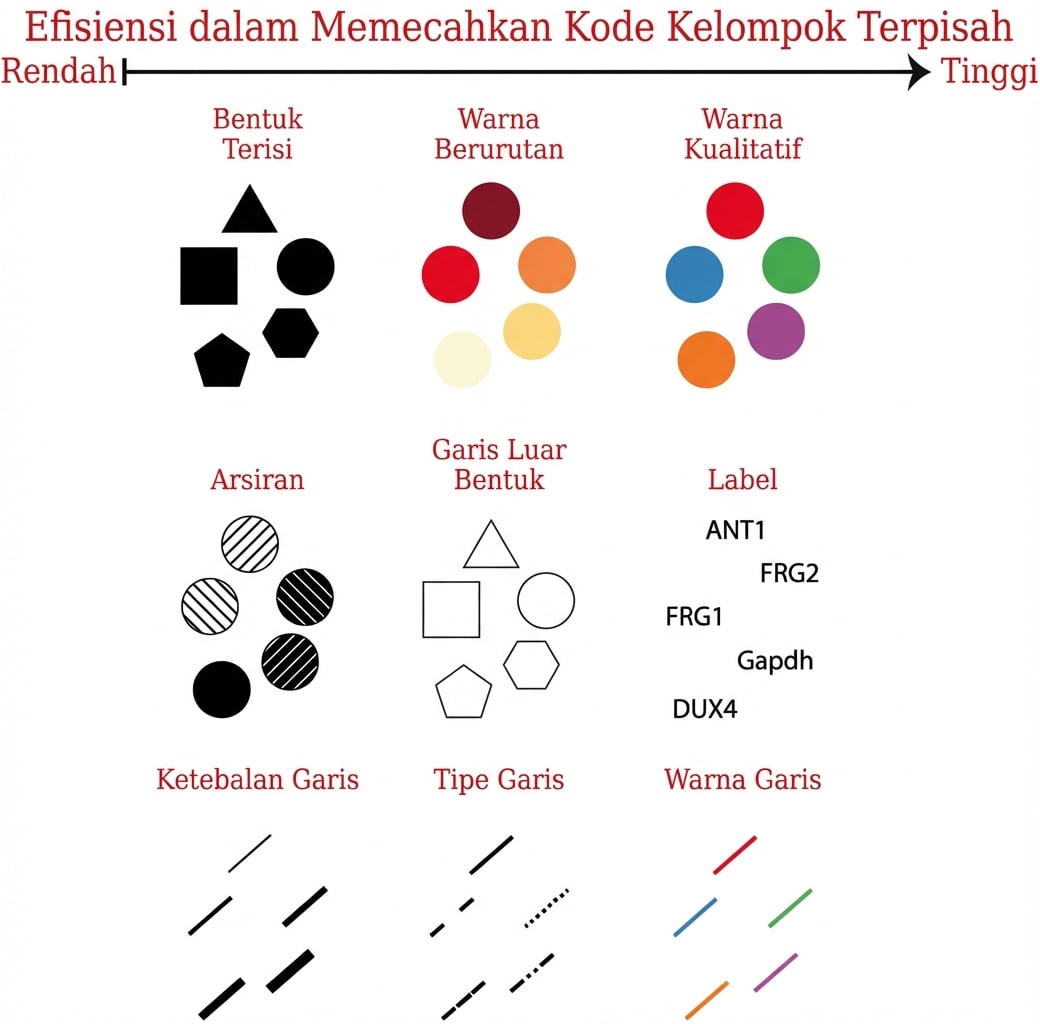
Aestetik untuk variabel kategorikal
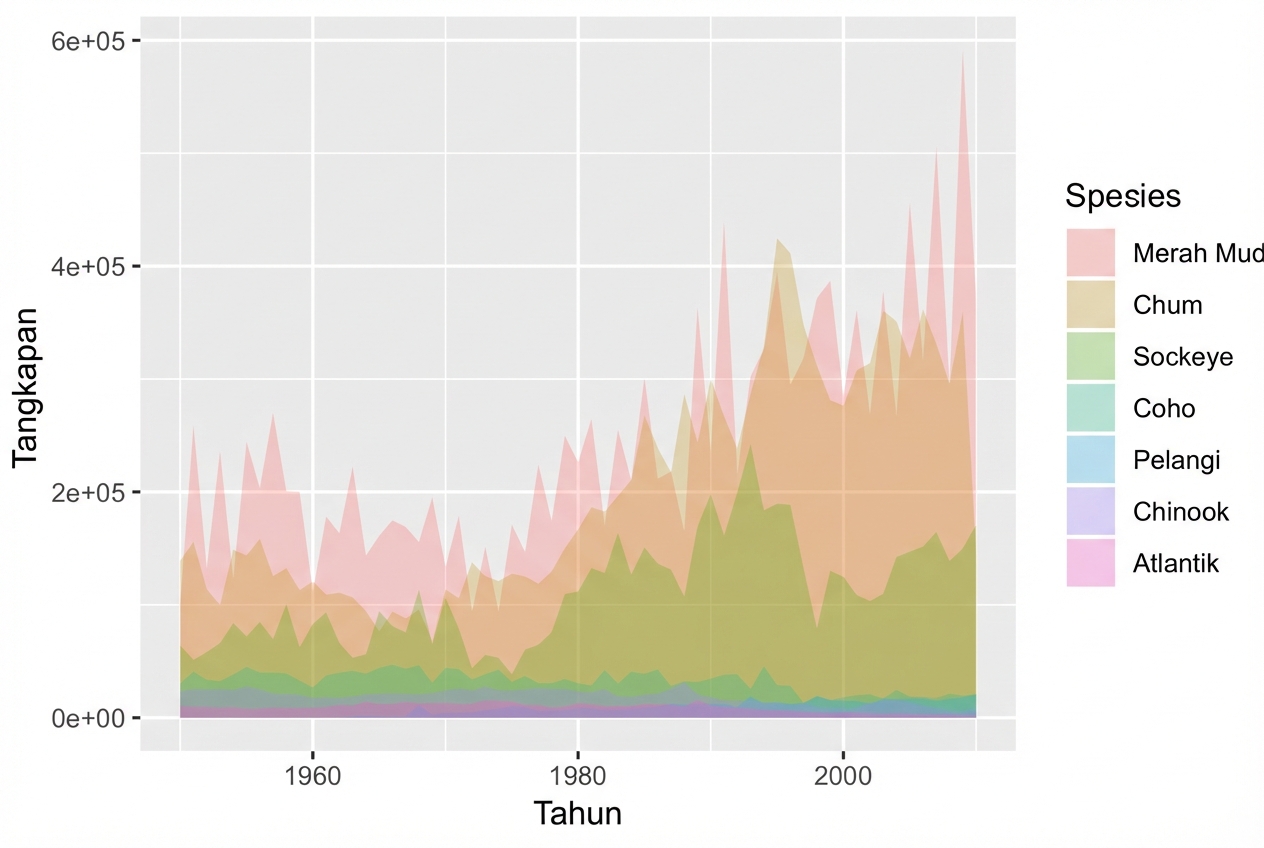
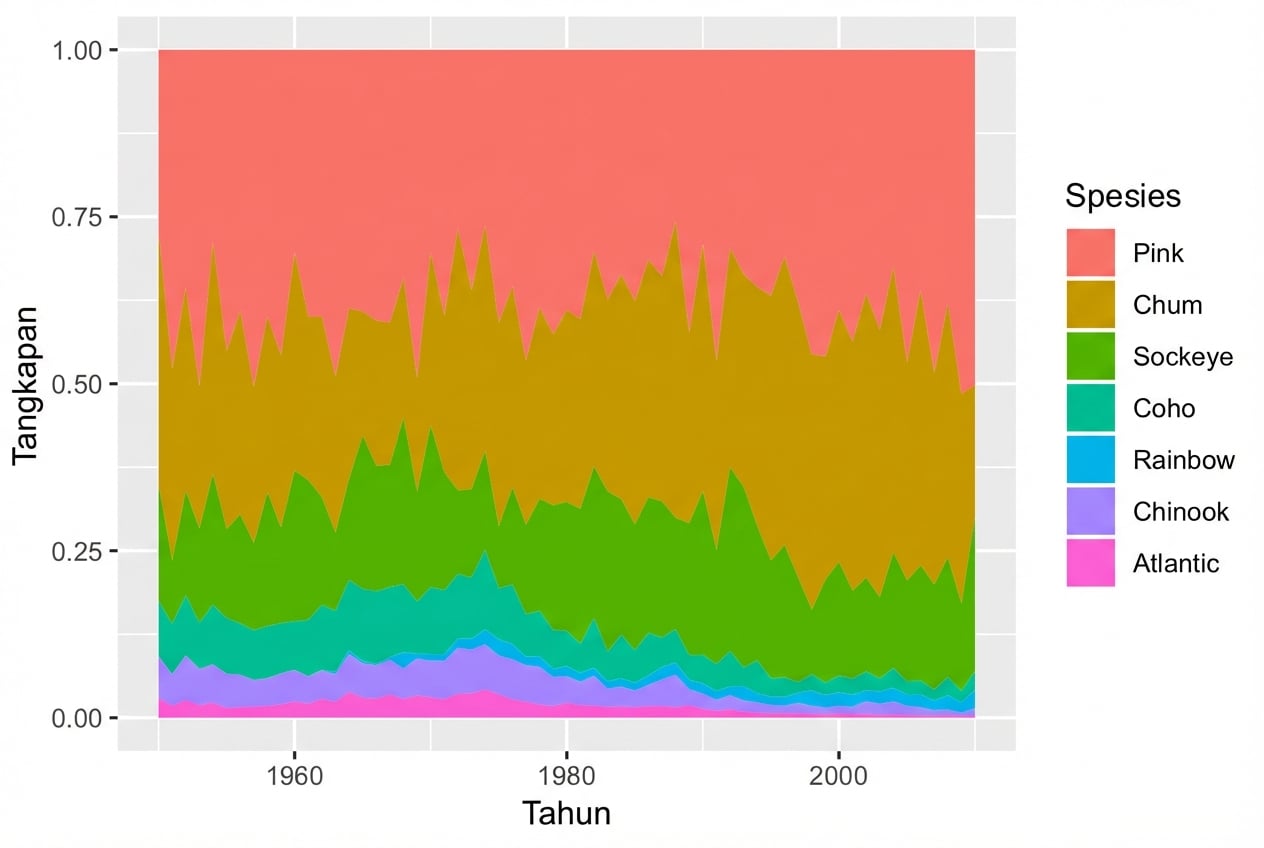
Aestetik fill dengan geom_area()
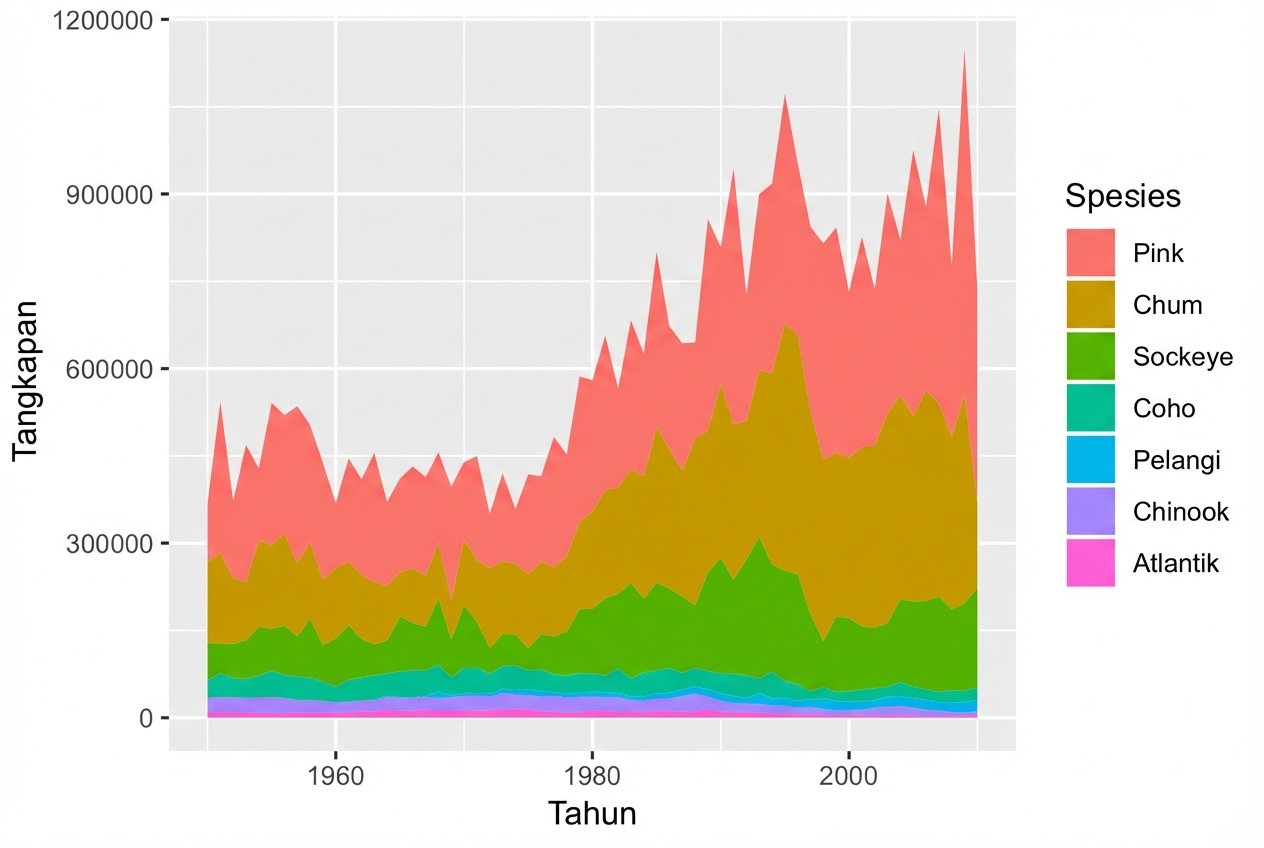
Menggunakan position = "fill"
geom_ribbon()