Praktik terbaik estetika
Pengantar Visualisasi Data dengan ggplot2

Rick Scavetta
Founder, Scavetta Academy
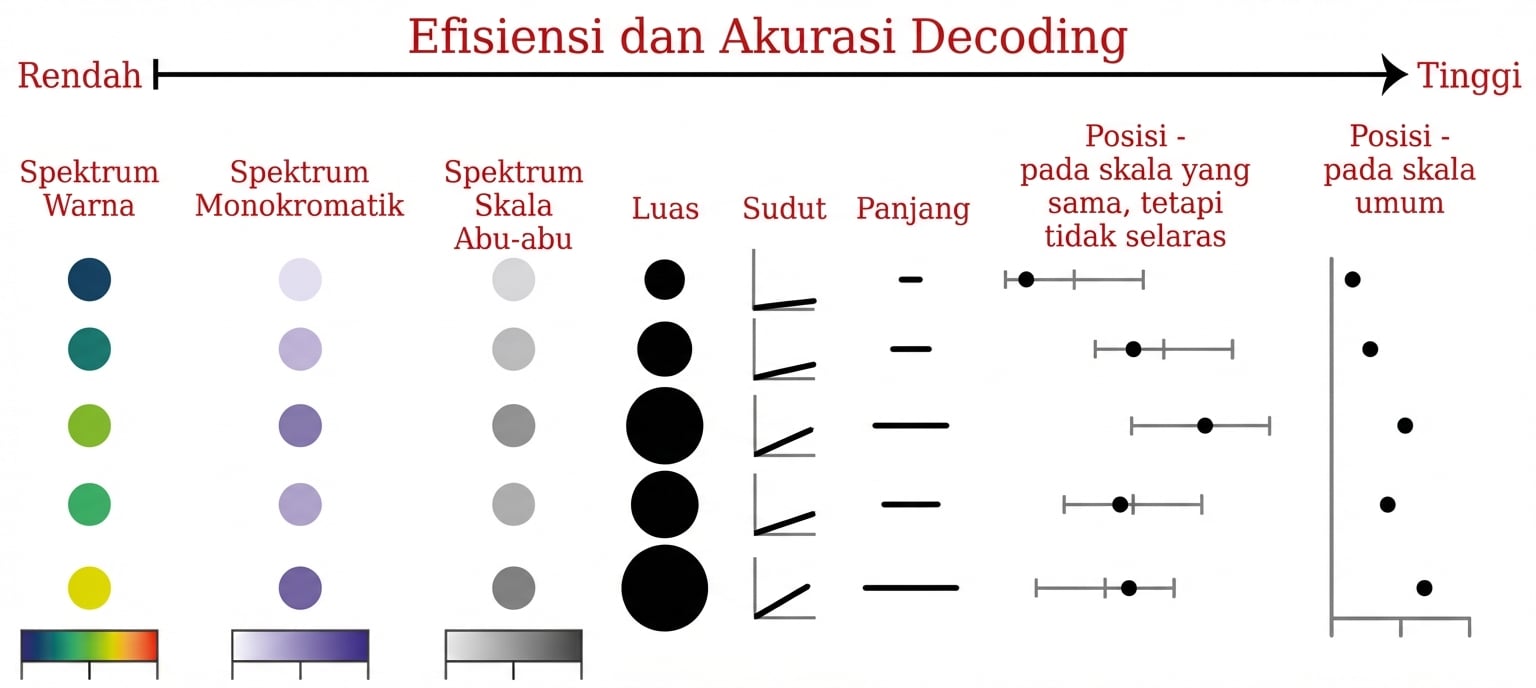
Bentuk mengikuti fungsi
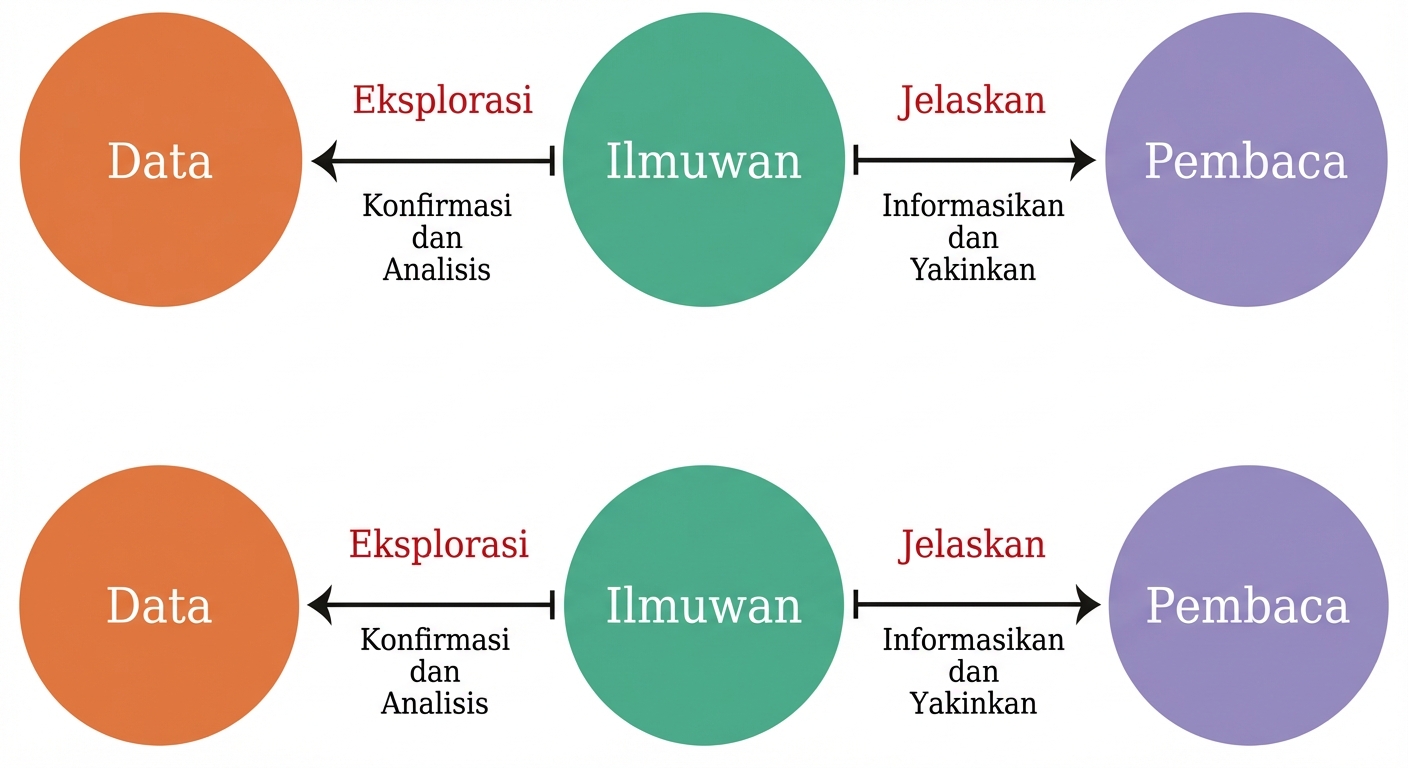
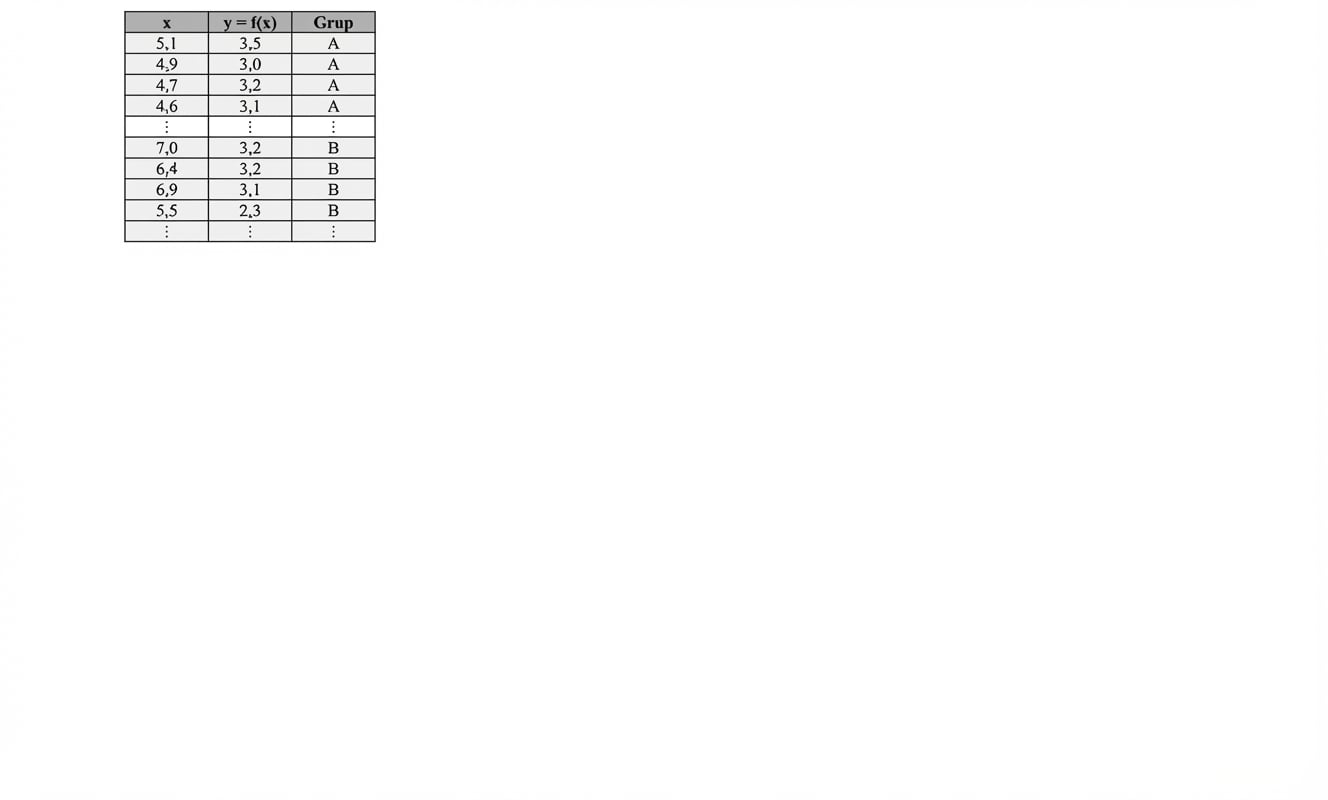
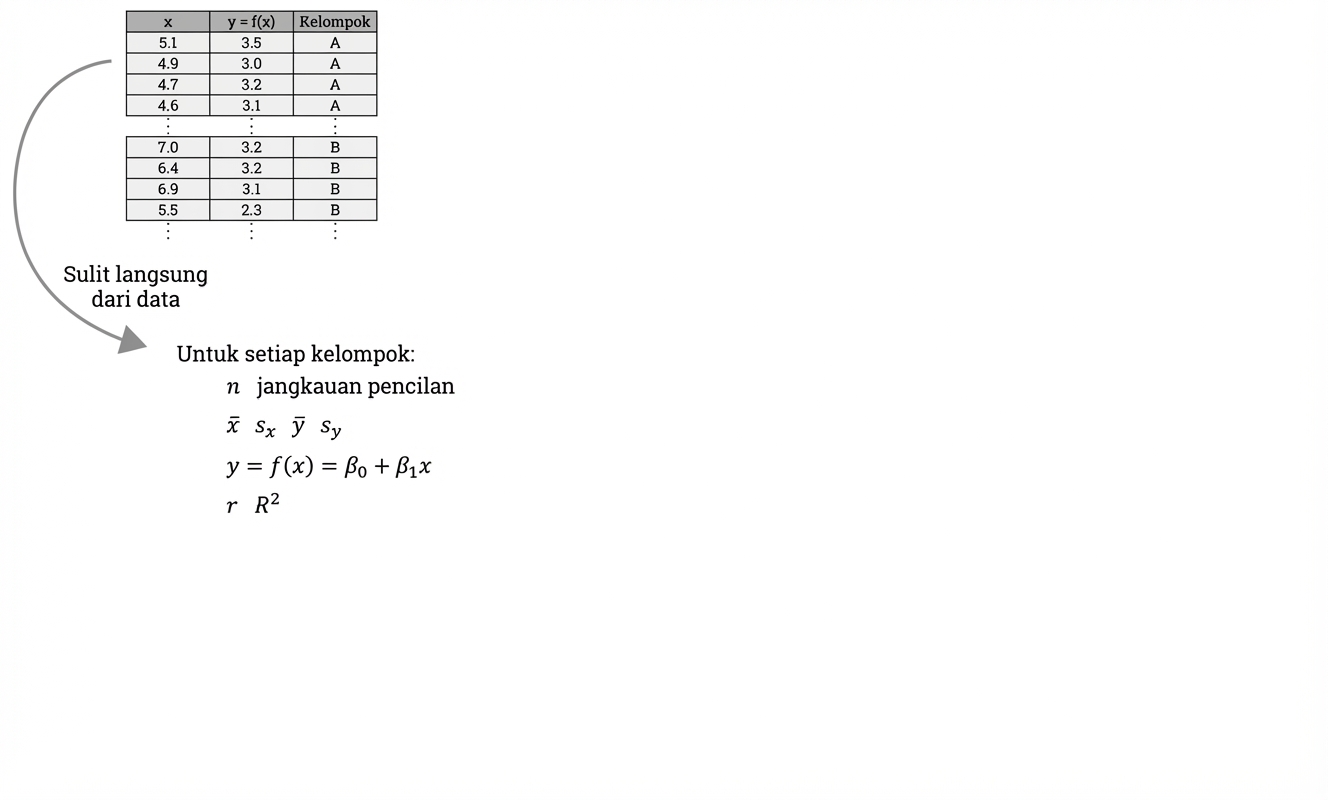
Menarik informasi dari data

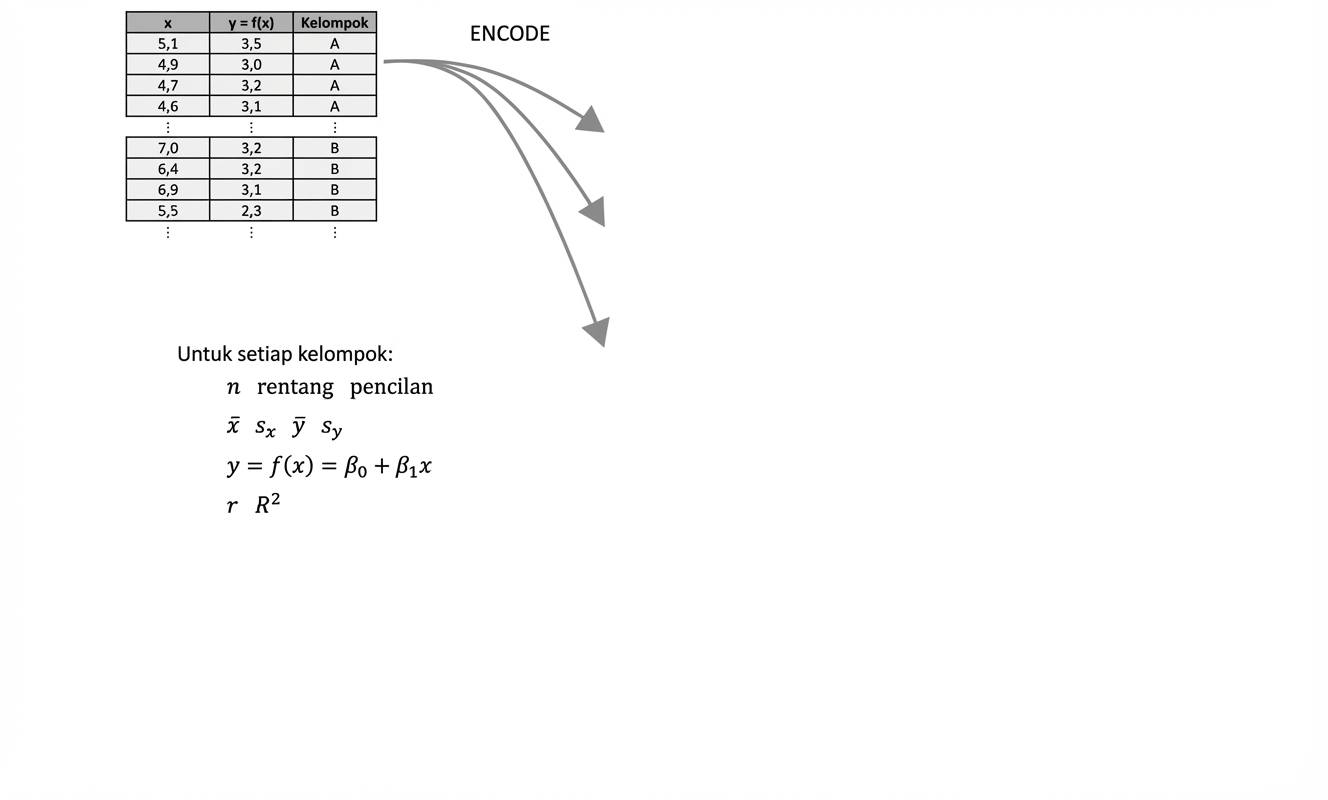
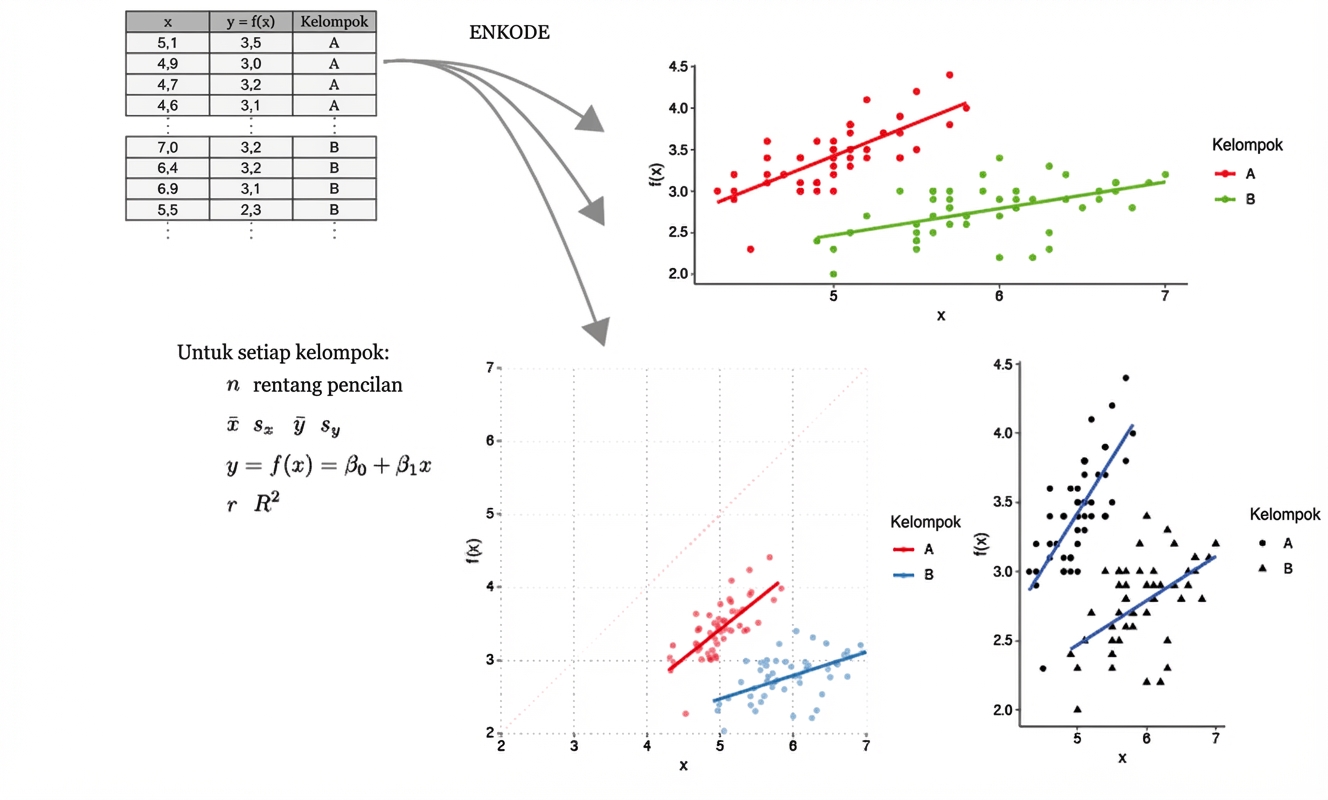
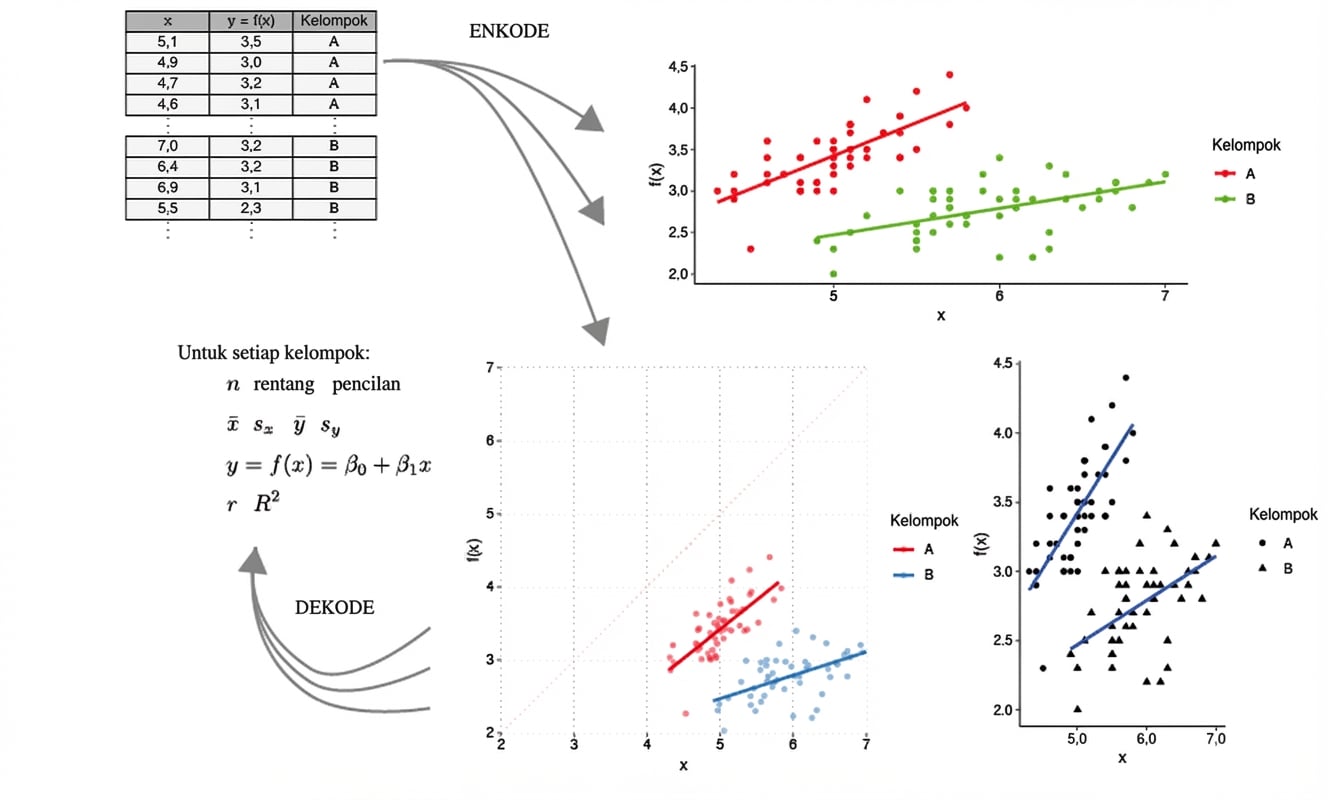
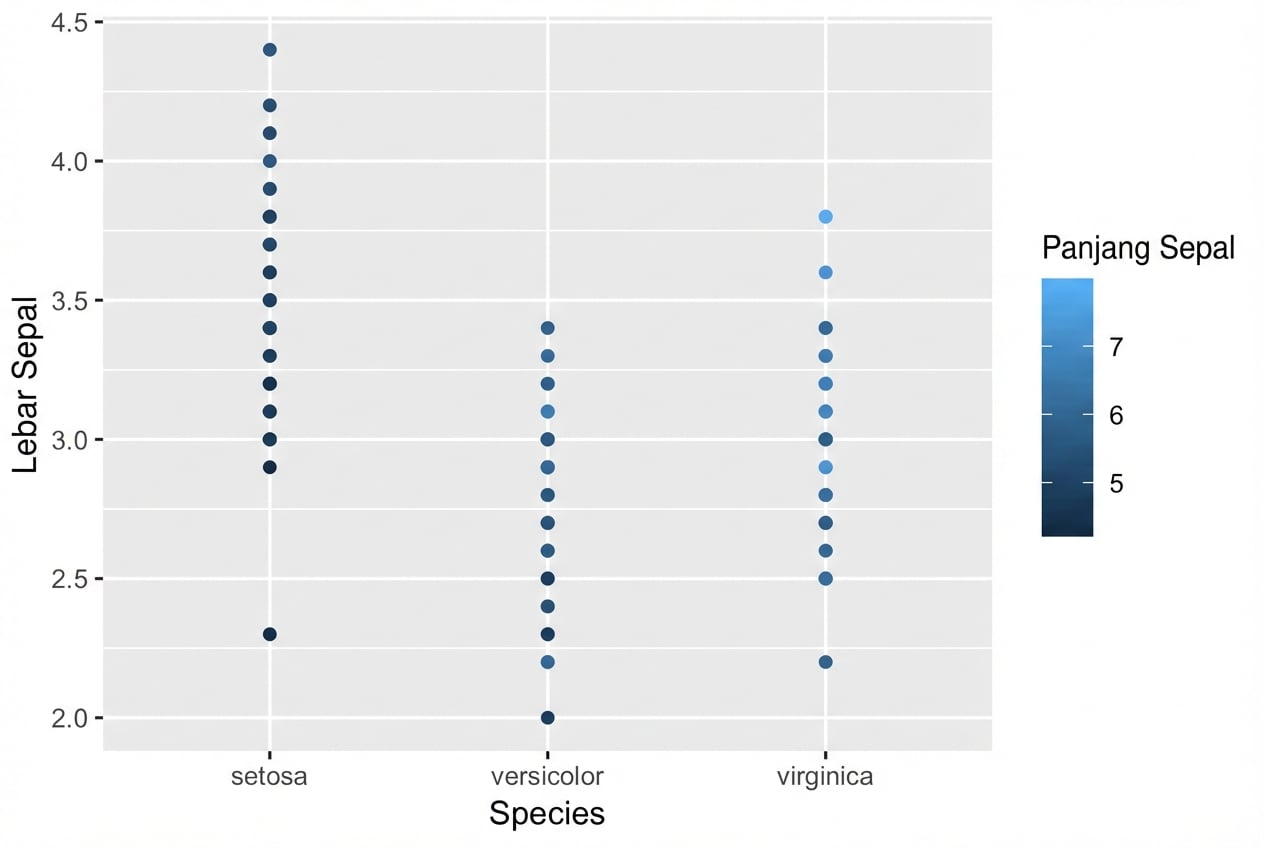
Estetika - variabel kontinu
Estetika - variabel kontinu
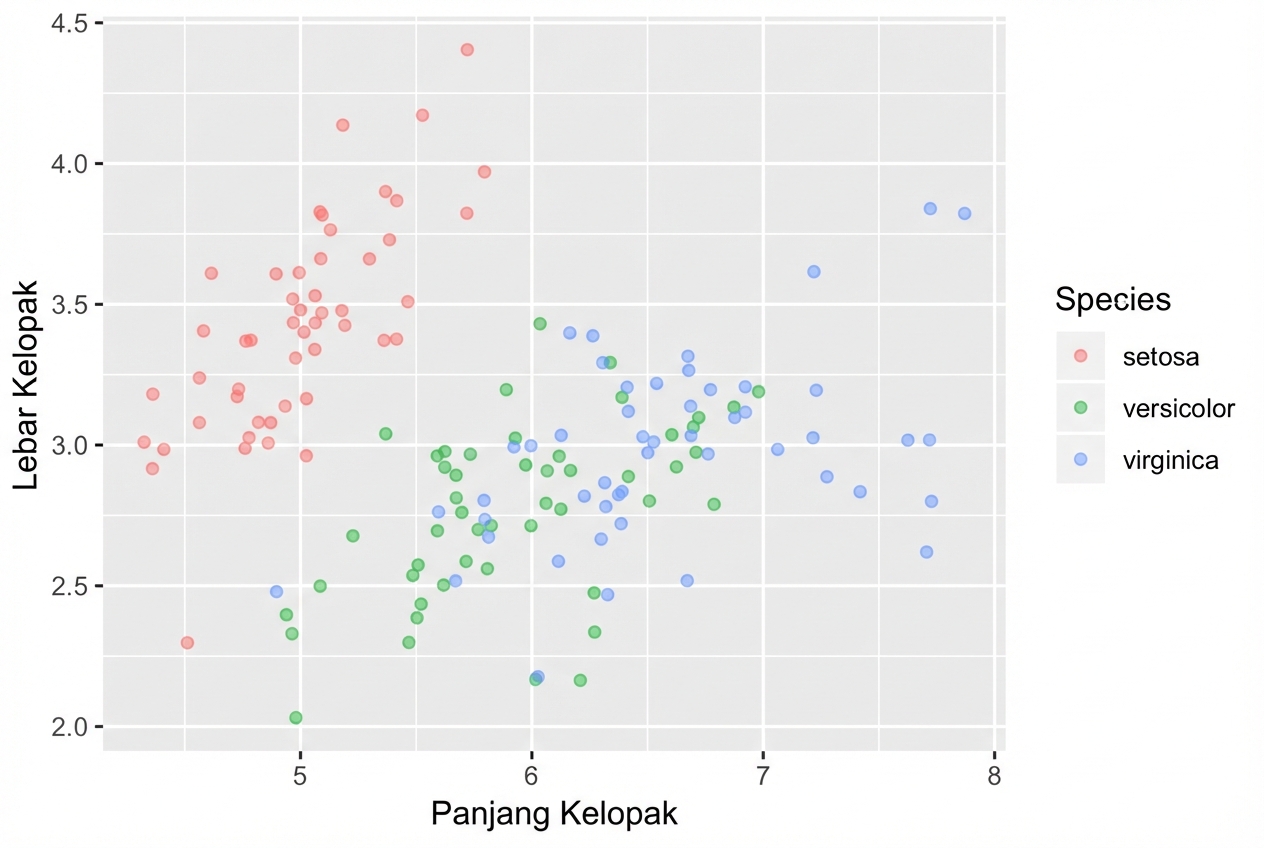
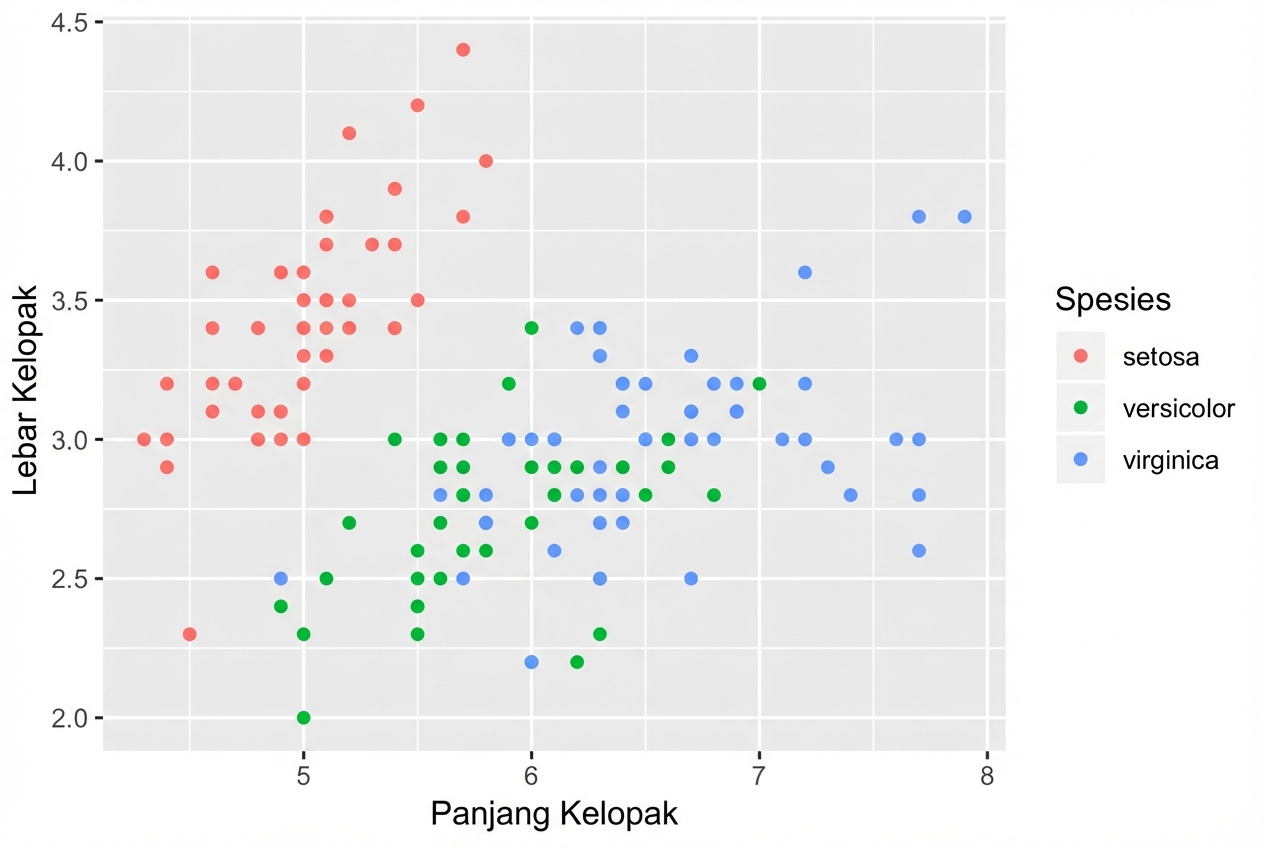
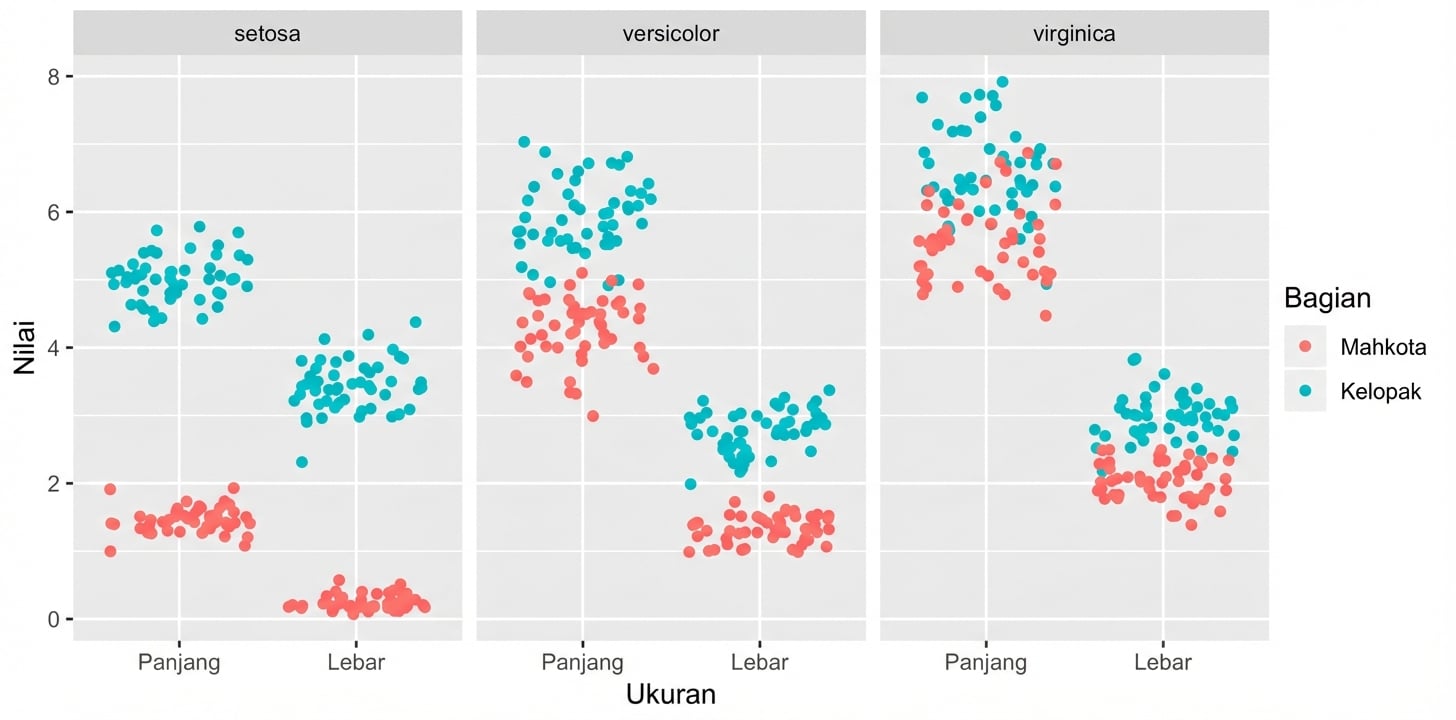
Tiga sebar iris
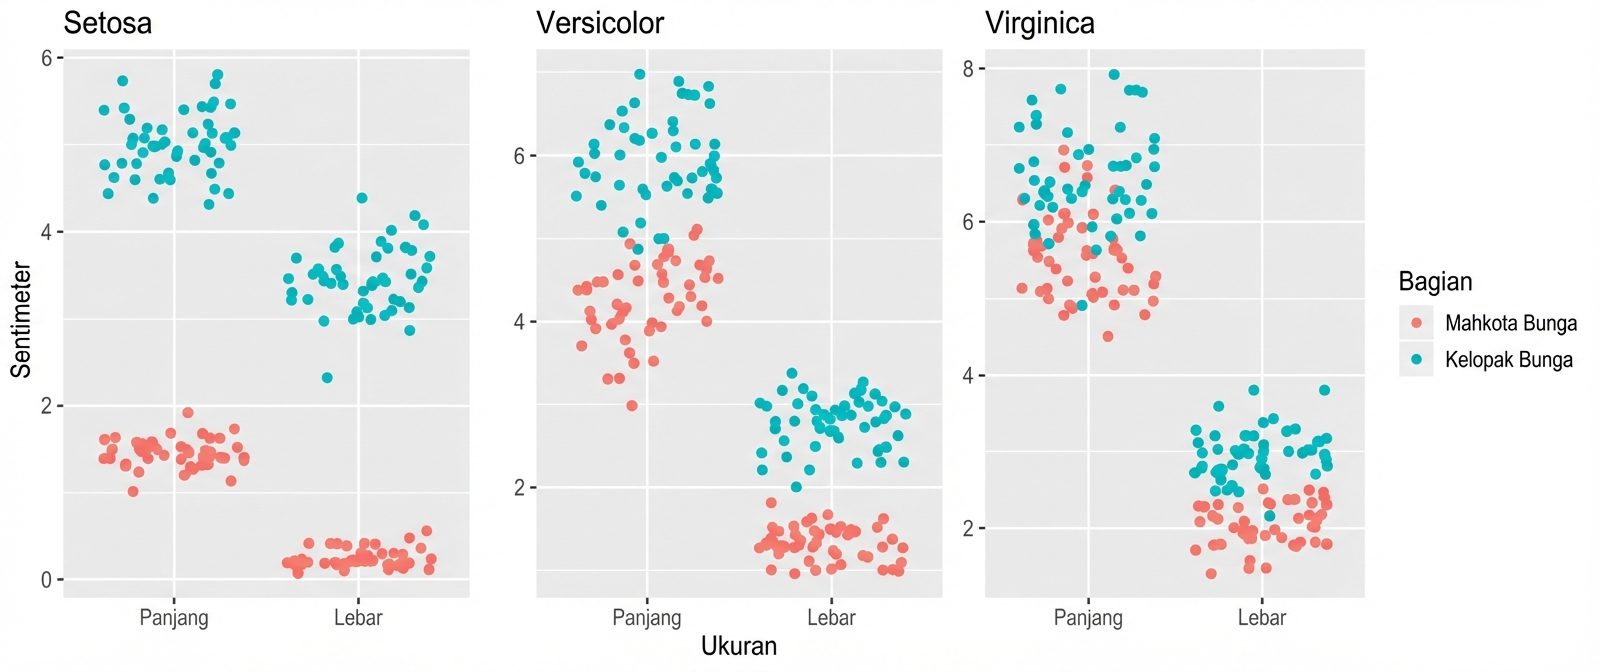
Tiga sebar iris, sumbu-y tak selaras
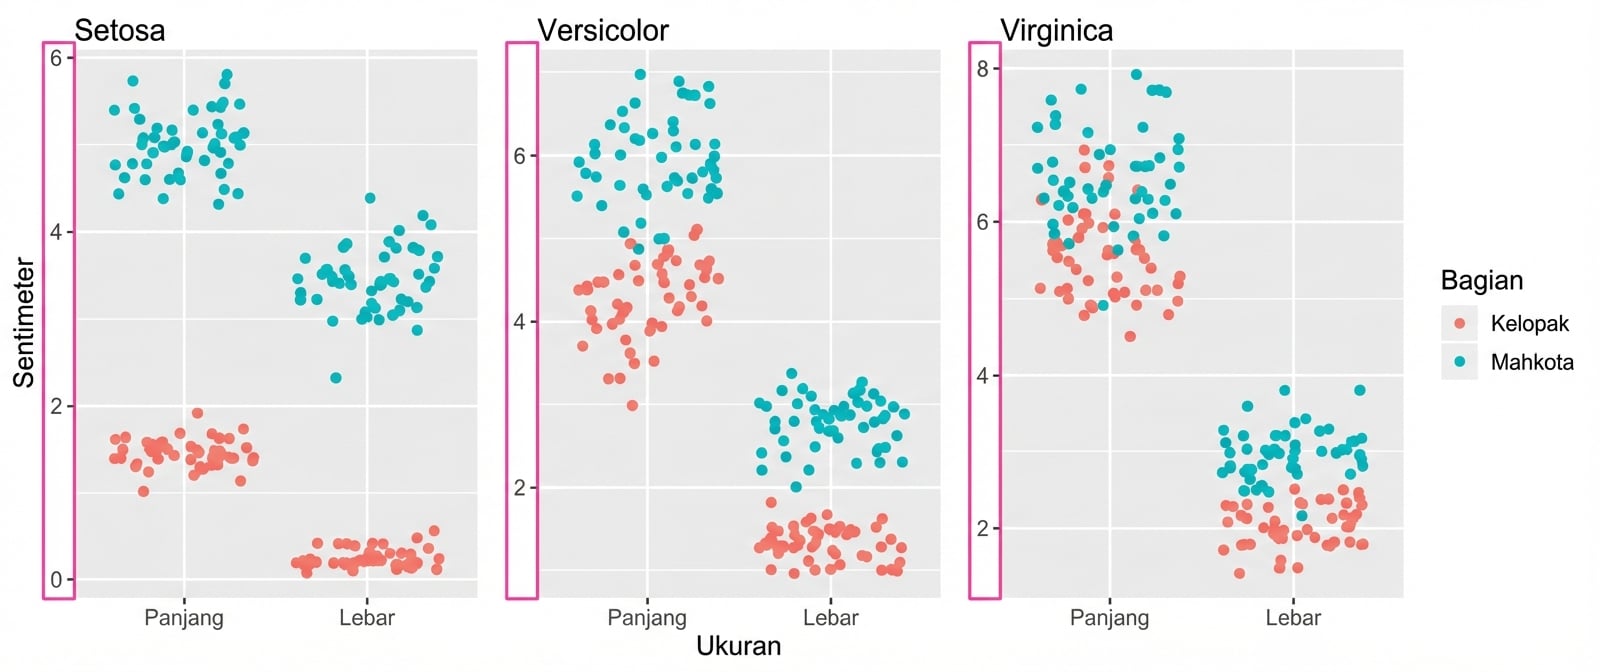
Plot berfasilit tunggal, sumbu-y umum
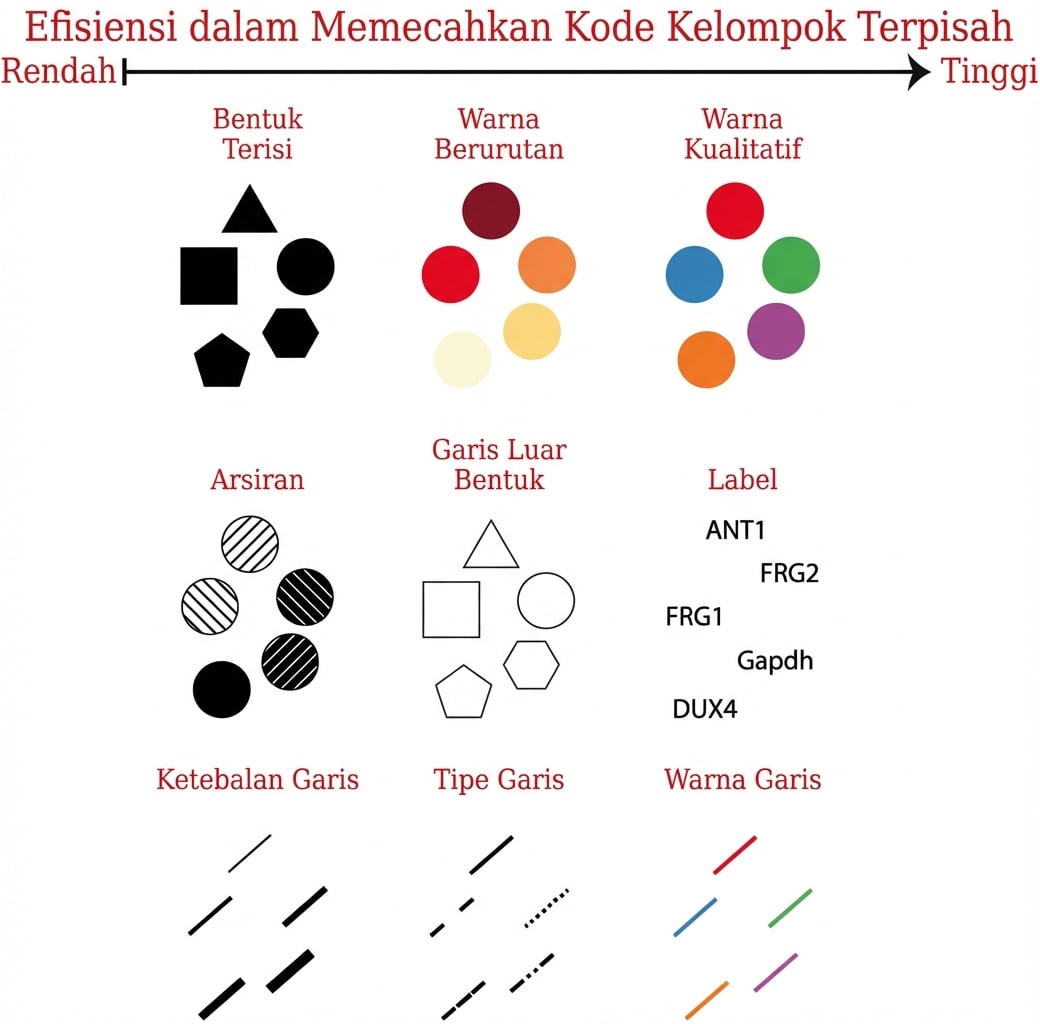
Estetika - variabel kategorikal
Estetika - variabel kategorikal