Pengantar Seaborn

Pengantar Visualisasi Data dengan Seaborn

Content Team

DataCamp

Apa itu Seaborn?

  • Pustaka visualisasi data Python
  • Mudah membuat jenis plot umum

Box plot total tagihan per hari, dibedakan pria vs. wanita

1 Waskom, M. L. (2021). seaborn: statistical data visualization. https://seaborn.pydata.org/
Pengantar Visualisasi Data dengan Seaborn

Mengapa Seaborn berguna?

Gambar alur kerja analisis data

Pengantar Visualisasi Data dengan Seaborn

Keunggulan Seaborn

  • Mudah digunakan
  • Cocok dengan struktur data pandas
  • Dibangun di atas matplotlib
Pengantar Visualisasi Data dengan Seaborn

Mulai

import seaborn as sns

import matplotlib.pyplot as plt

Samuel Norman Seaborn (sns)

  • Acara TV "The West Wing"
Pengantar Visualisasi Data dengan Seaborn

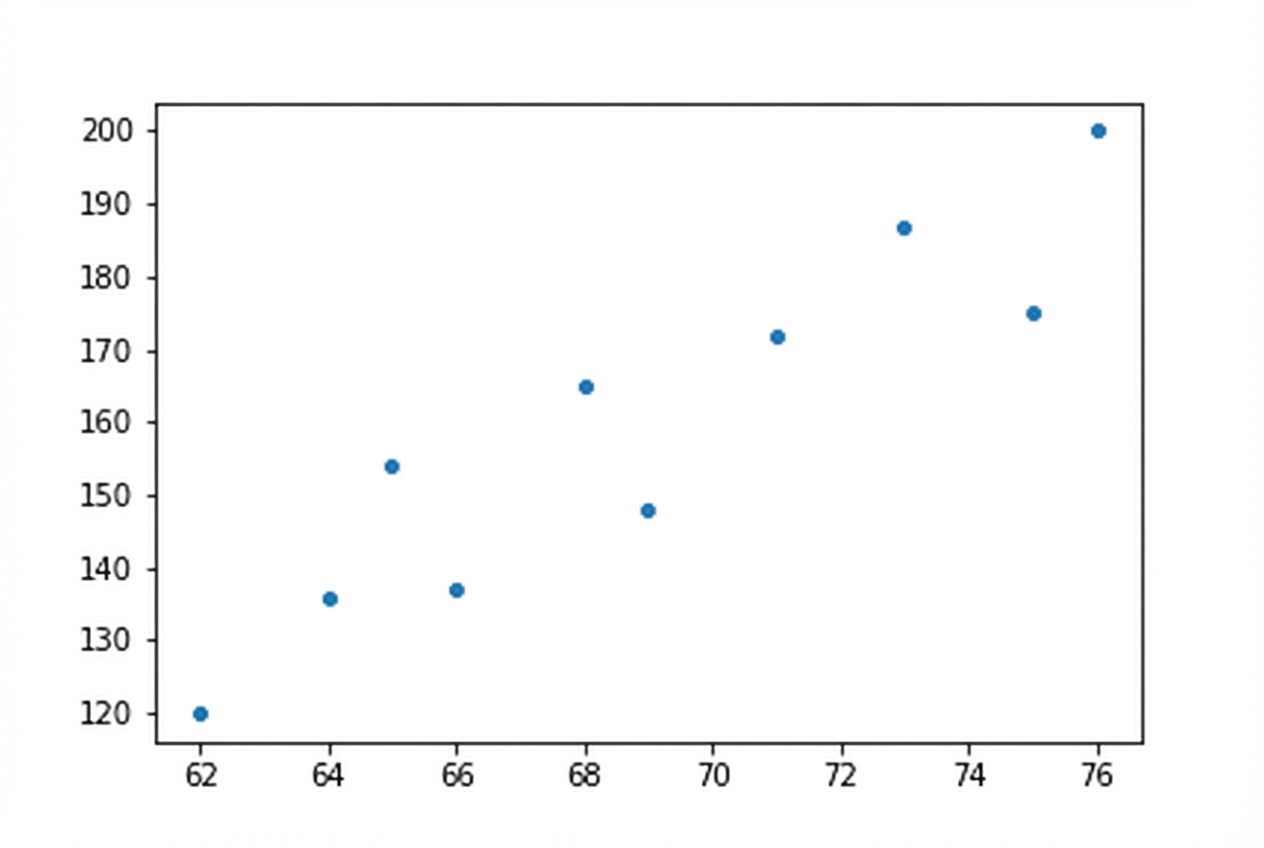
Contoh 1: Scatter plot

import seaborn as sns
import matplotlib.pyplot as plt

height = [62, 64, 69, 75, 66, 68, 65, 71, 76, 73] weight = [120, 136, 148, 175, 137, 165, 154, 172, 200, 187]
sns.scatterplot(x=height, y=weight)
plt.show()

Plot sebar tinggi vs. berat

Pengantar Visualisasi Data dengan Seaborn

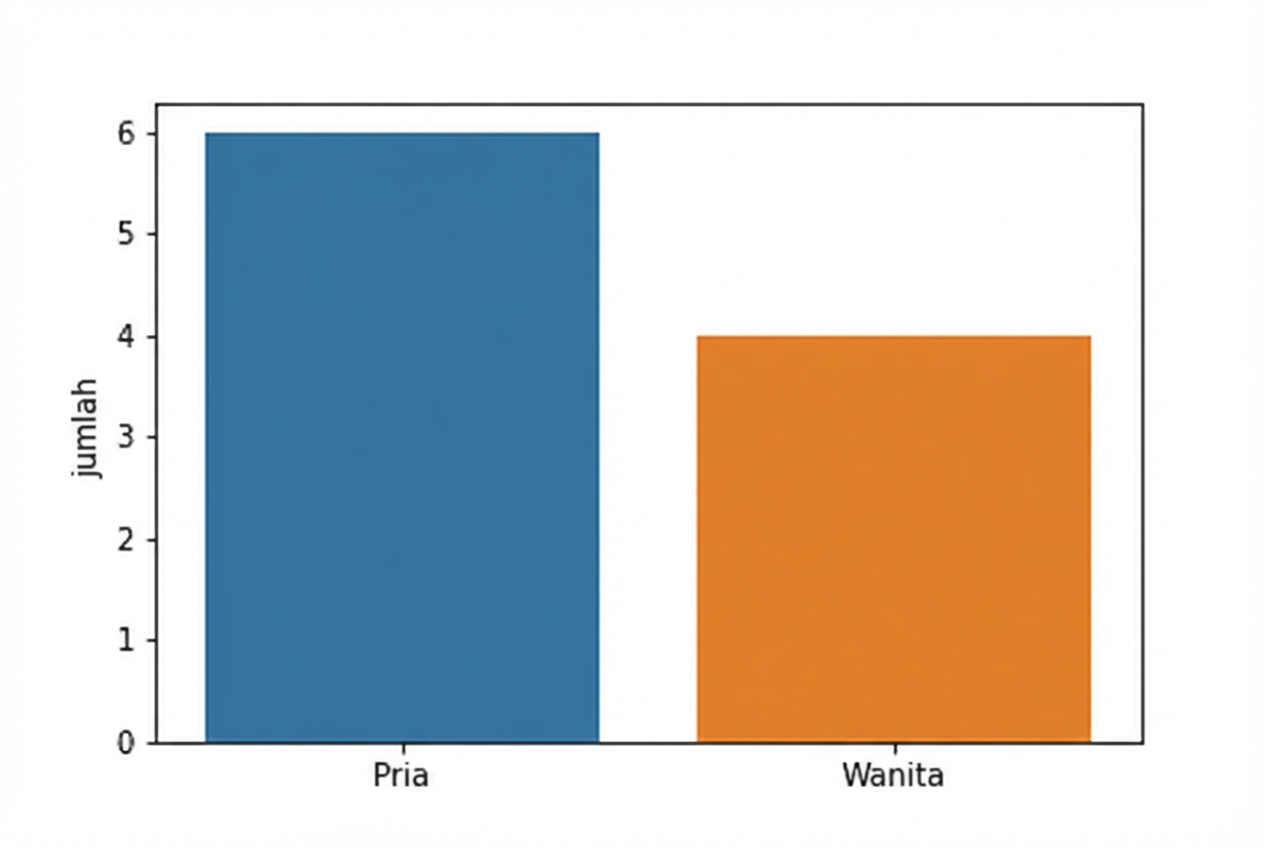
Contoh 2: Buat count plot

import seaborn as sns
import matplotlib.pyplot as plt

gender = ["Female", "Female", "Female", "Female", "Male", "Male", "Male", "Male", "Male", "Male"]
sns.countplot(x=gender)
plt.show()

Count plot gender

Pengantar Visualisasi Data dengan Seaborn

Scatter plot dengan warna hue hitam dan merah

Line plot dengan marker dan garis solid

Point plot maskulinitas dengan hue

Scatter plot horsepower vs. mpg dengan palet sekuensial

1 Waskom, M. L. (2021). seaborn: statistical data visualization. https://seaborn.pydata.org/
Pengantar Visualisasi Data dengan Seaborn

Ayo berlatih!

Pengantar Visualisasi Data dengan Seaborn

Preparing Video For Download...