Ukuran sebaran
Pengantar Statistika di R

Maggie Matsui
Content Developer, DataCamp
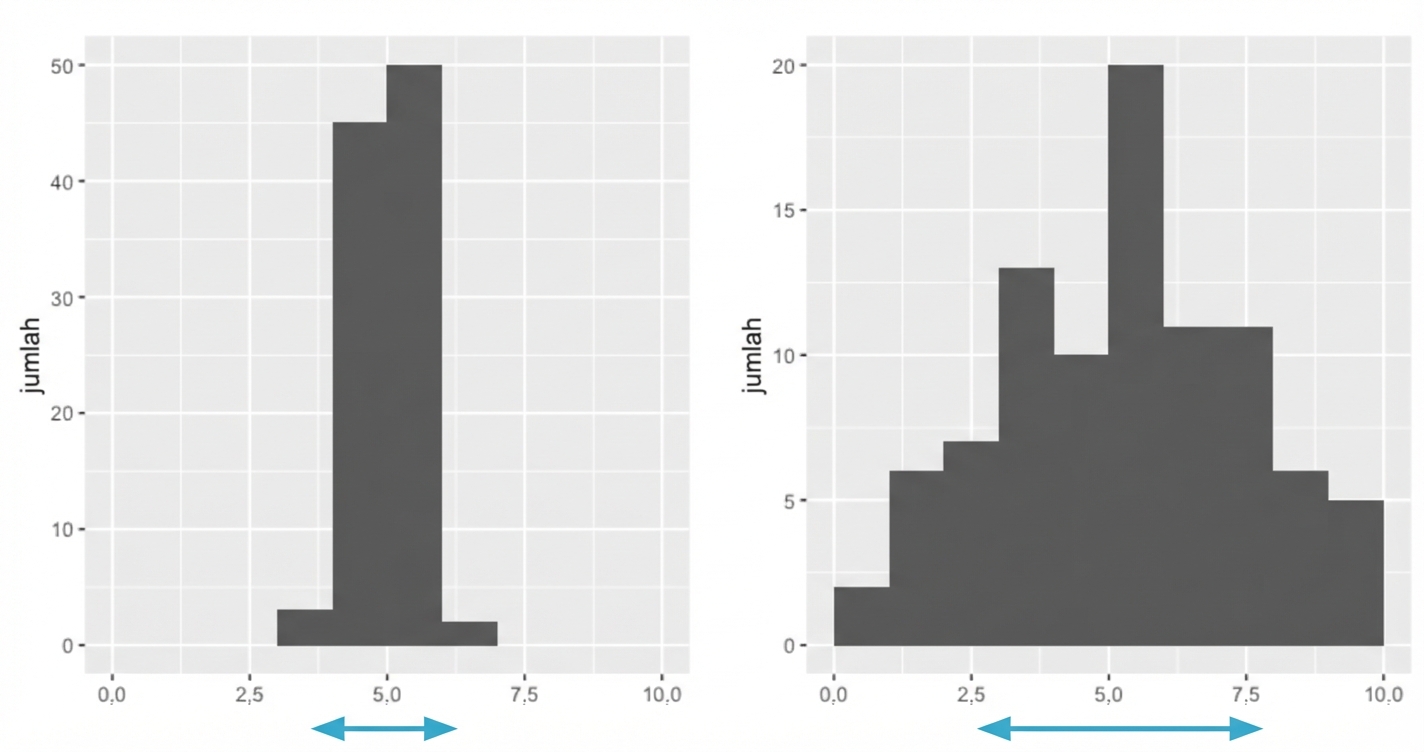
Apa itu sebaran?
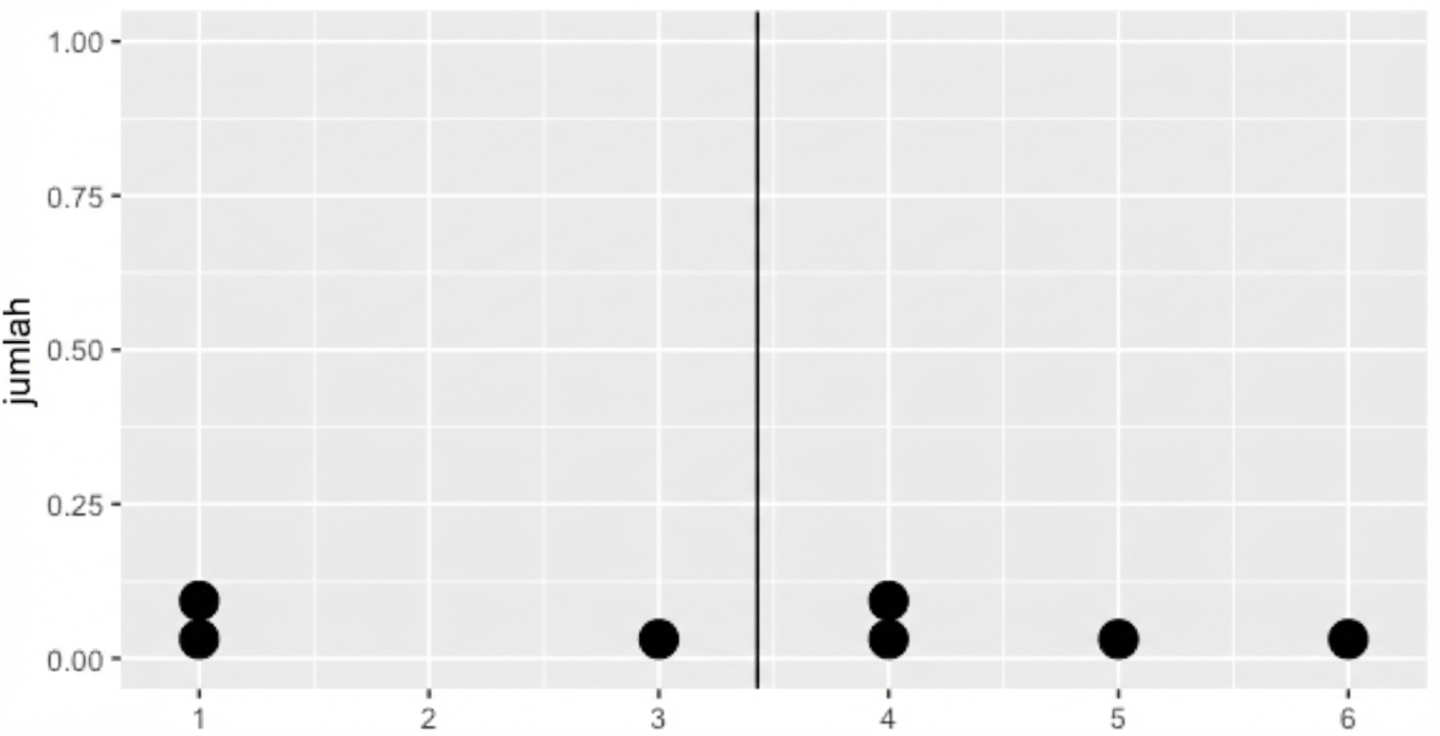
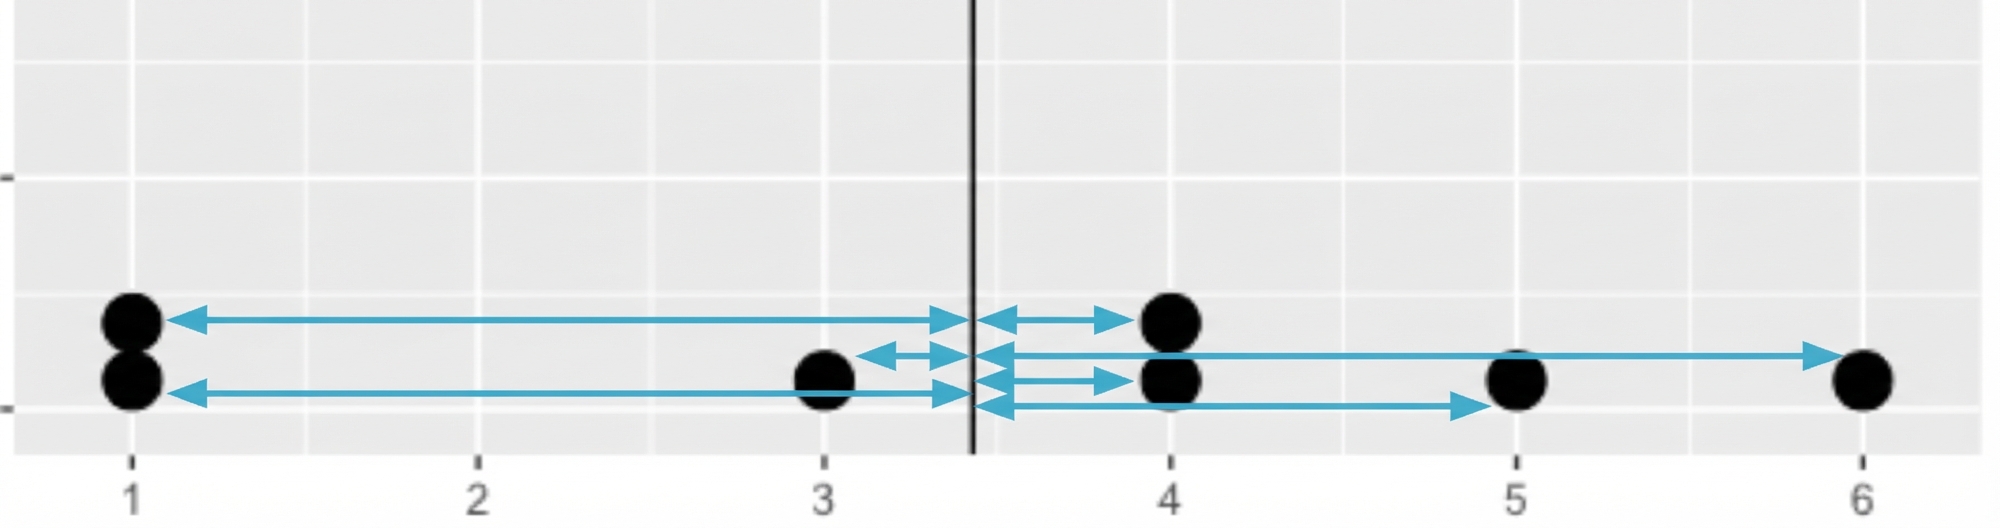
Varians
Rata-rata jarak tiap titik data ke mean data
Menghitung varians
dists <- msleep$sleep_total - mean(msleep$sleep_total)
dists
1.66626506 6.56626506 ... -4.13373494 2.06626506 -0.63373494
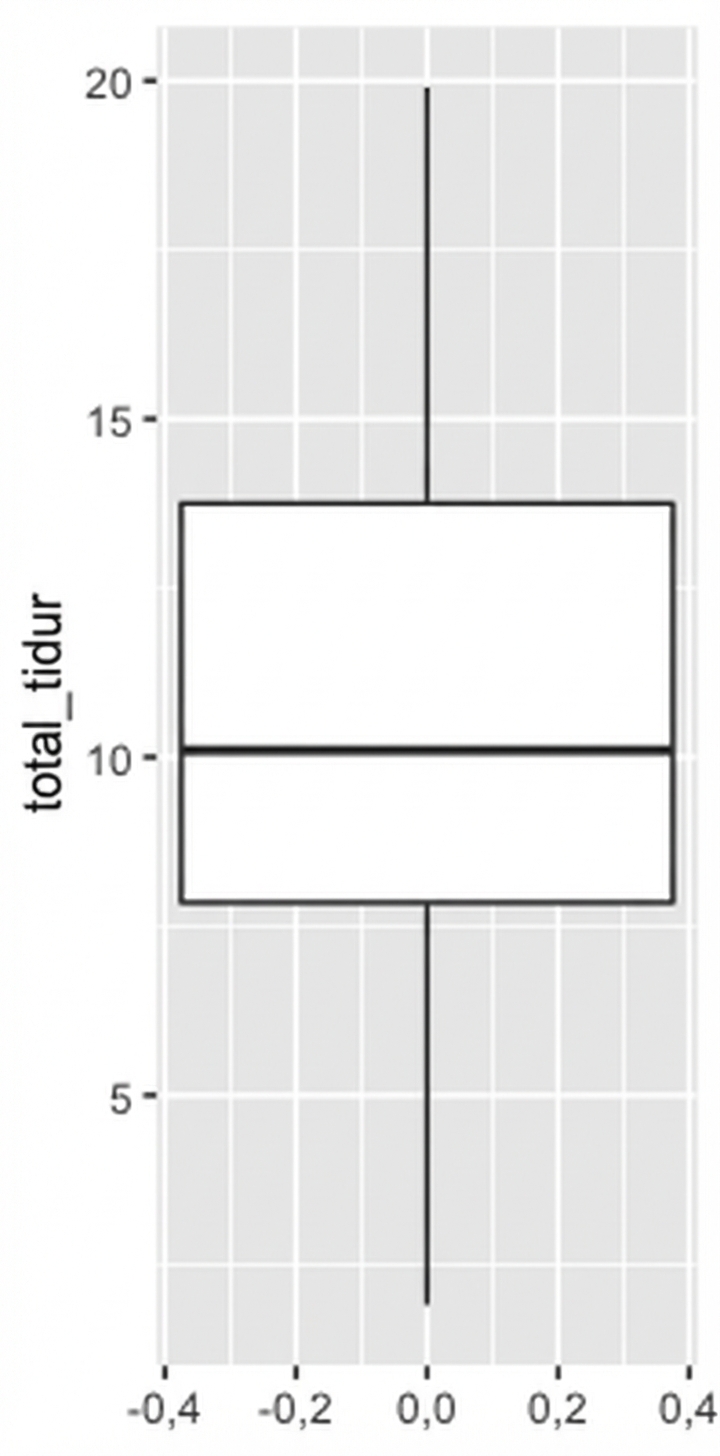
Boxplot menggunakan kuartil