Membuat plot garis
Pengantar Data Science dengan Python

Hillary Green-Lerman
Lead Data Scientist, Looker
Plot makin menarik

Dari DataFrame ke visualisasi
Pengenalan Matplotlib
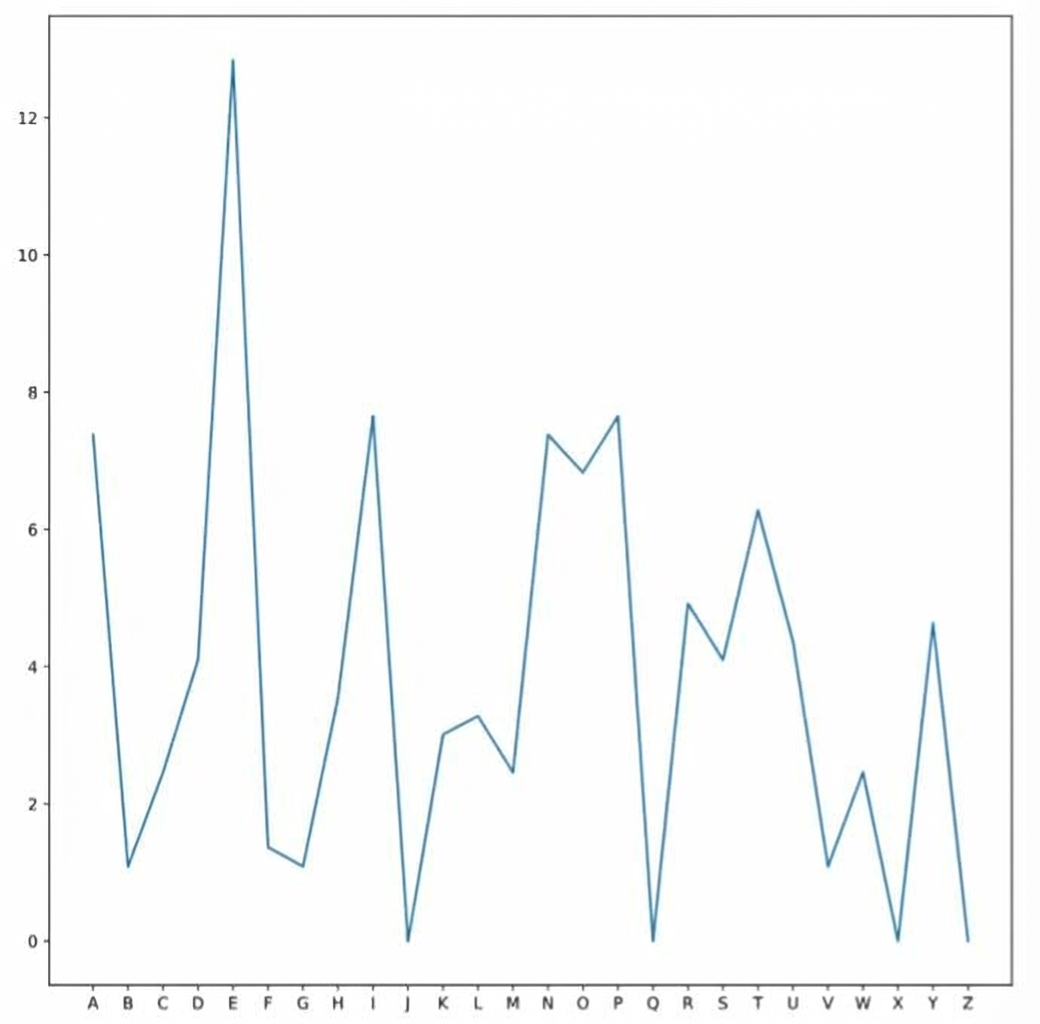
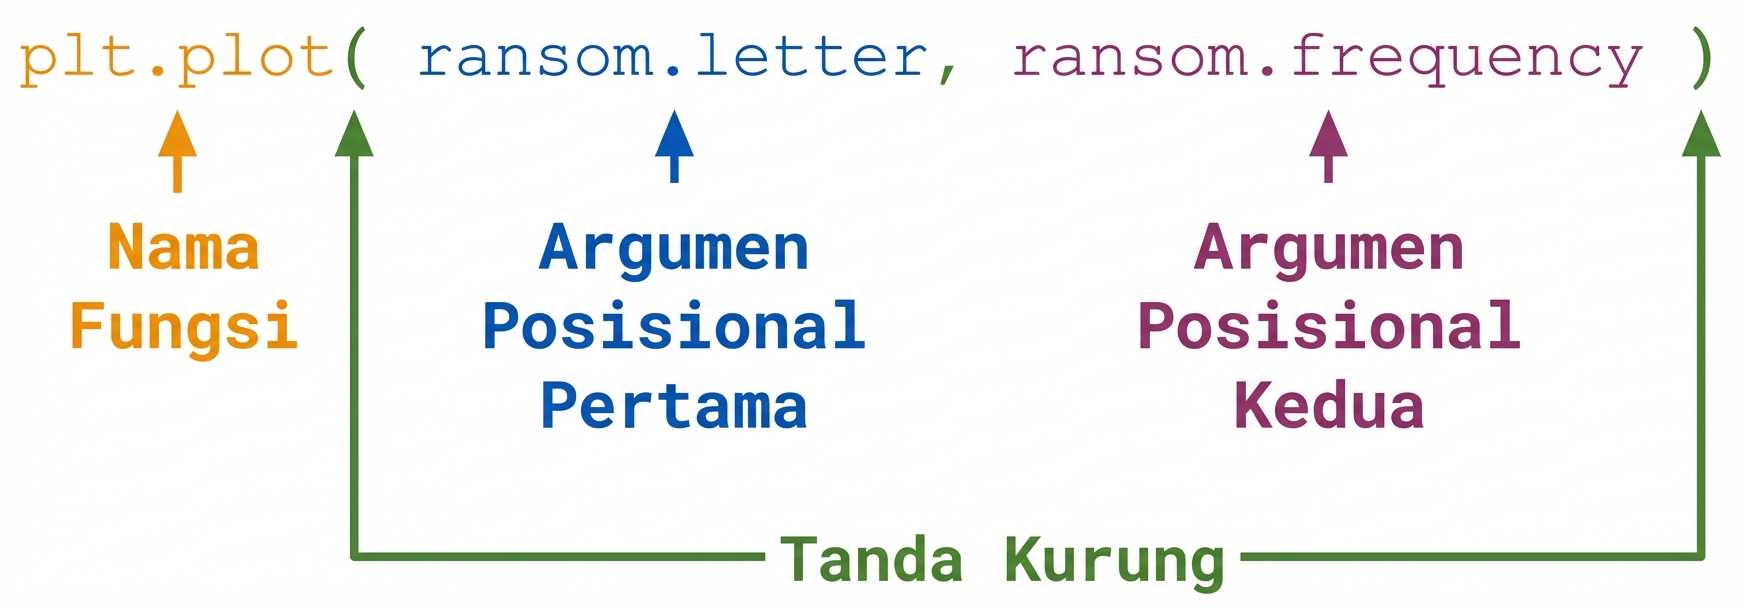
Plot garis
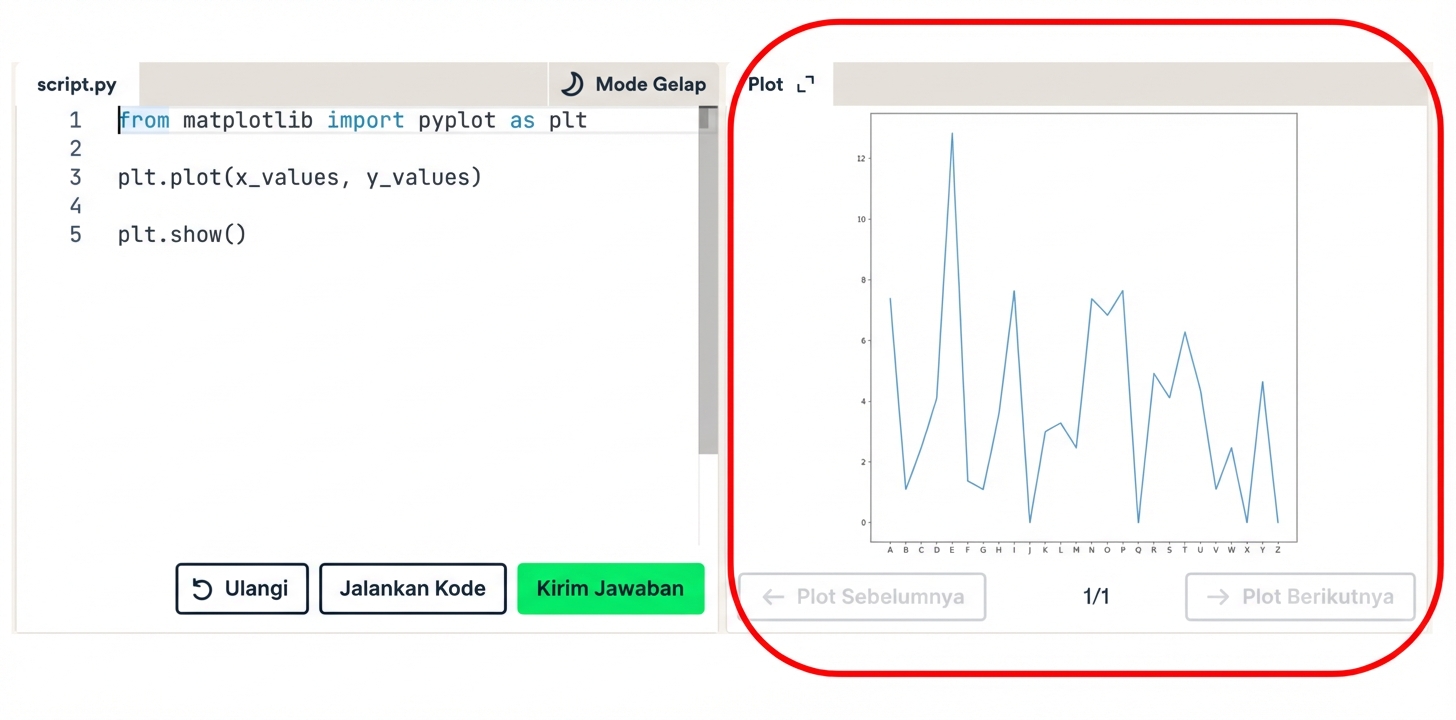
Menampilkan hasil
plt.show()
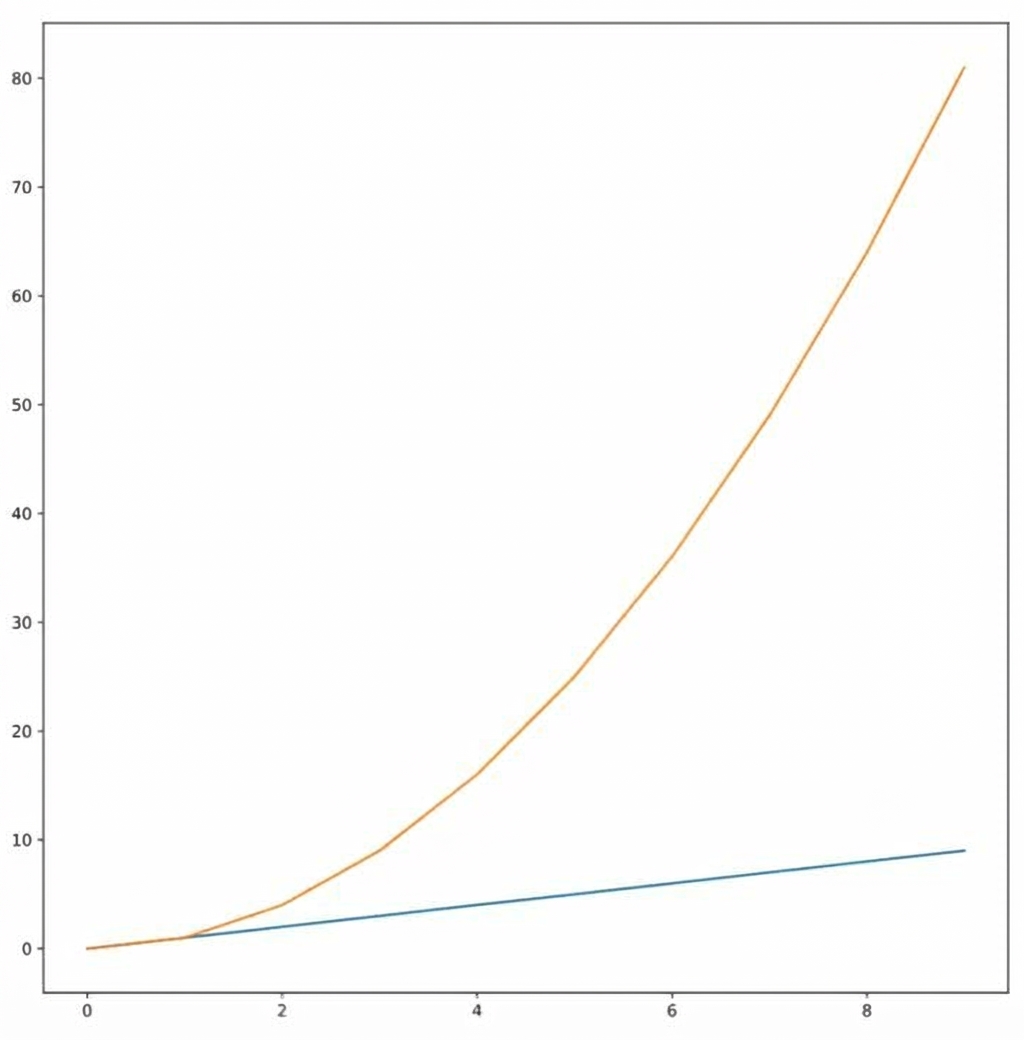
Beberapa garis
Pengantar Data Science dengan Python
Hillary Green-Lerman
Lead Data Scientist, Looker
plt.show()

